As of 2023, only 62.2% of U.S. college students have successfully earned their degrees. While that’s an improvement from past years, it still means nearly 4 in 10 students don’t graduate.
Women are leading in completion rates, and younger students tend to finish more often than older ones. From rising Hispanic graduate numbers to ongoing challenges for Black and Indigenous students, graduation trends show both progress and gaps in U.S. higher education.
Let’s break down the latest stats to see who’s graduating—and who’s being left behind. In this article, we’ll explore college graduation rates by gender, race, age, degree type, and institution.
College Graduation Statistics 2025: Top Picks
- In 2023, only 62.2% of U.S. college students graduated.
- More women (66%) graduated than men (58%).
- Students aged 18 or younger had the highest graduation rate at 66.9%, while those aged 24–29 had a very low rate of 8.4%.
- Asian students had the highest graduation rate at 74.8%, White students followed with 65.6%, and Black students had the lowest at 42.6%.
- Graduation rates were 77.5% at private nonprofit colleges, 67.4% at public colleges, and only 46% at private for-profit colleges.
Average College Graduation Rate
In 2023, the National Student Clearinghouse Research Center (NSCRC) reported that the graduation rate for colleges across the United States reached 62.2%. This means that just over 6 in 10 students who started college successfully graduated.
While this is a positive number, it’s interesting to note that it’s slightly higher than the average graduation rate of 60% observed from 2008 to 2021 at four-year colleges, according to the National Center for Education Statistics (NCES).
This small increase indicates that more students are managing to complete their degrees, but it also highlights that nearly 4 in 10 students still face challenges in finishing their college education.
Source: National Student Clearinghouse Research Center (NSCRC)
College Graduate Demographics
The demographics of college graduates reveal important trends and disparities in higher education.
Gender, age, and race all play significant roles in graduation rates, with women consistently outpacing men, younger students graduating at higher rates than older ones, and certain racial and ethnic groups facing significant challenges.
College Graduates By Gender
66% of women students graduated from college in 2023, compared to 58% of men, showing a clear and ongoing gender gap in college completion.
71% of women at public four-year colleges earned their degrees, while only 63% of men did the same. At private nonprofit four-year colleges, 80% of women graduated, outpacing 74% of men. Even at public two-year colleges, where overall graduation rates are lower, 47% of women completed their programs, compared to 41% of men.
This trend isn’t new. Between 2008 and 2022, women have consistently graduated from four-year institutions at rates about 4 to 6 percentage points higher than men. These numbers highlight an ongoing challenge in closing the graduation gap between genders in higher education.
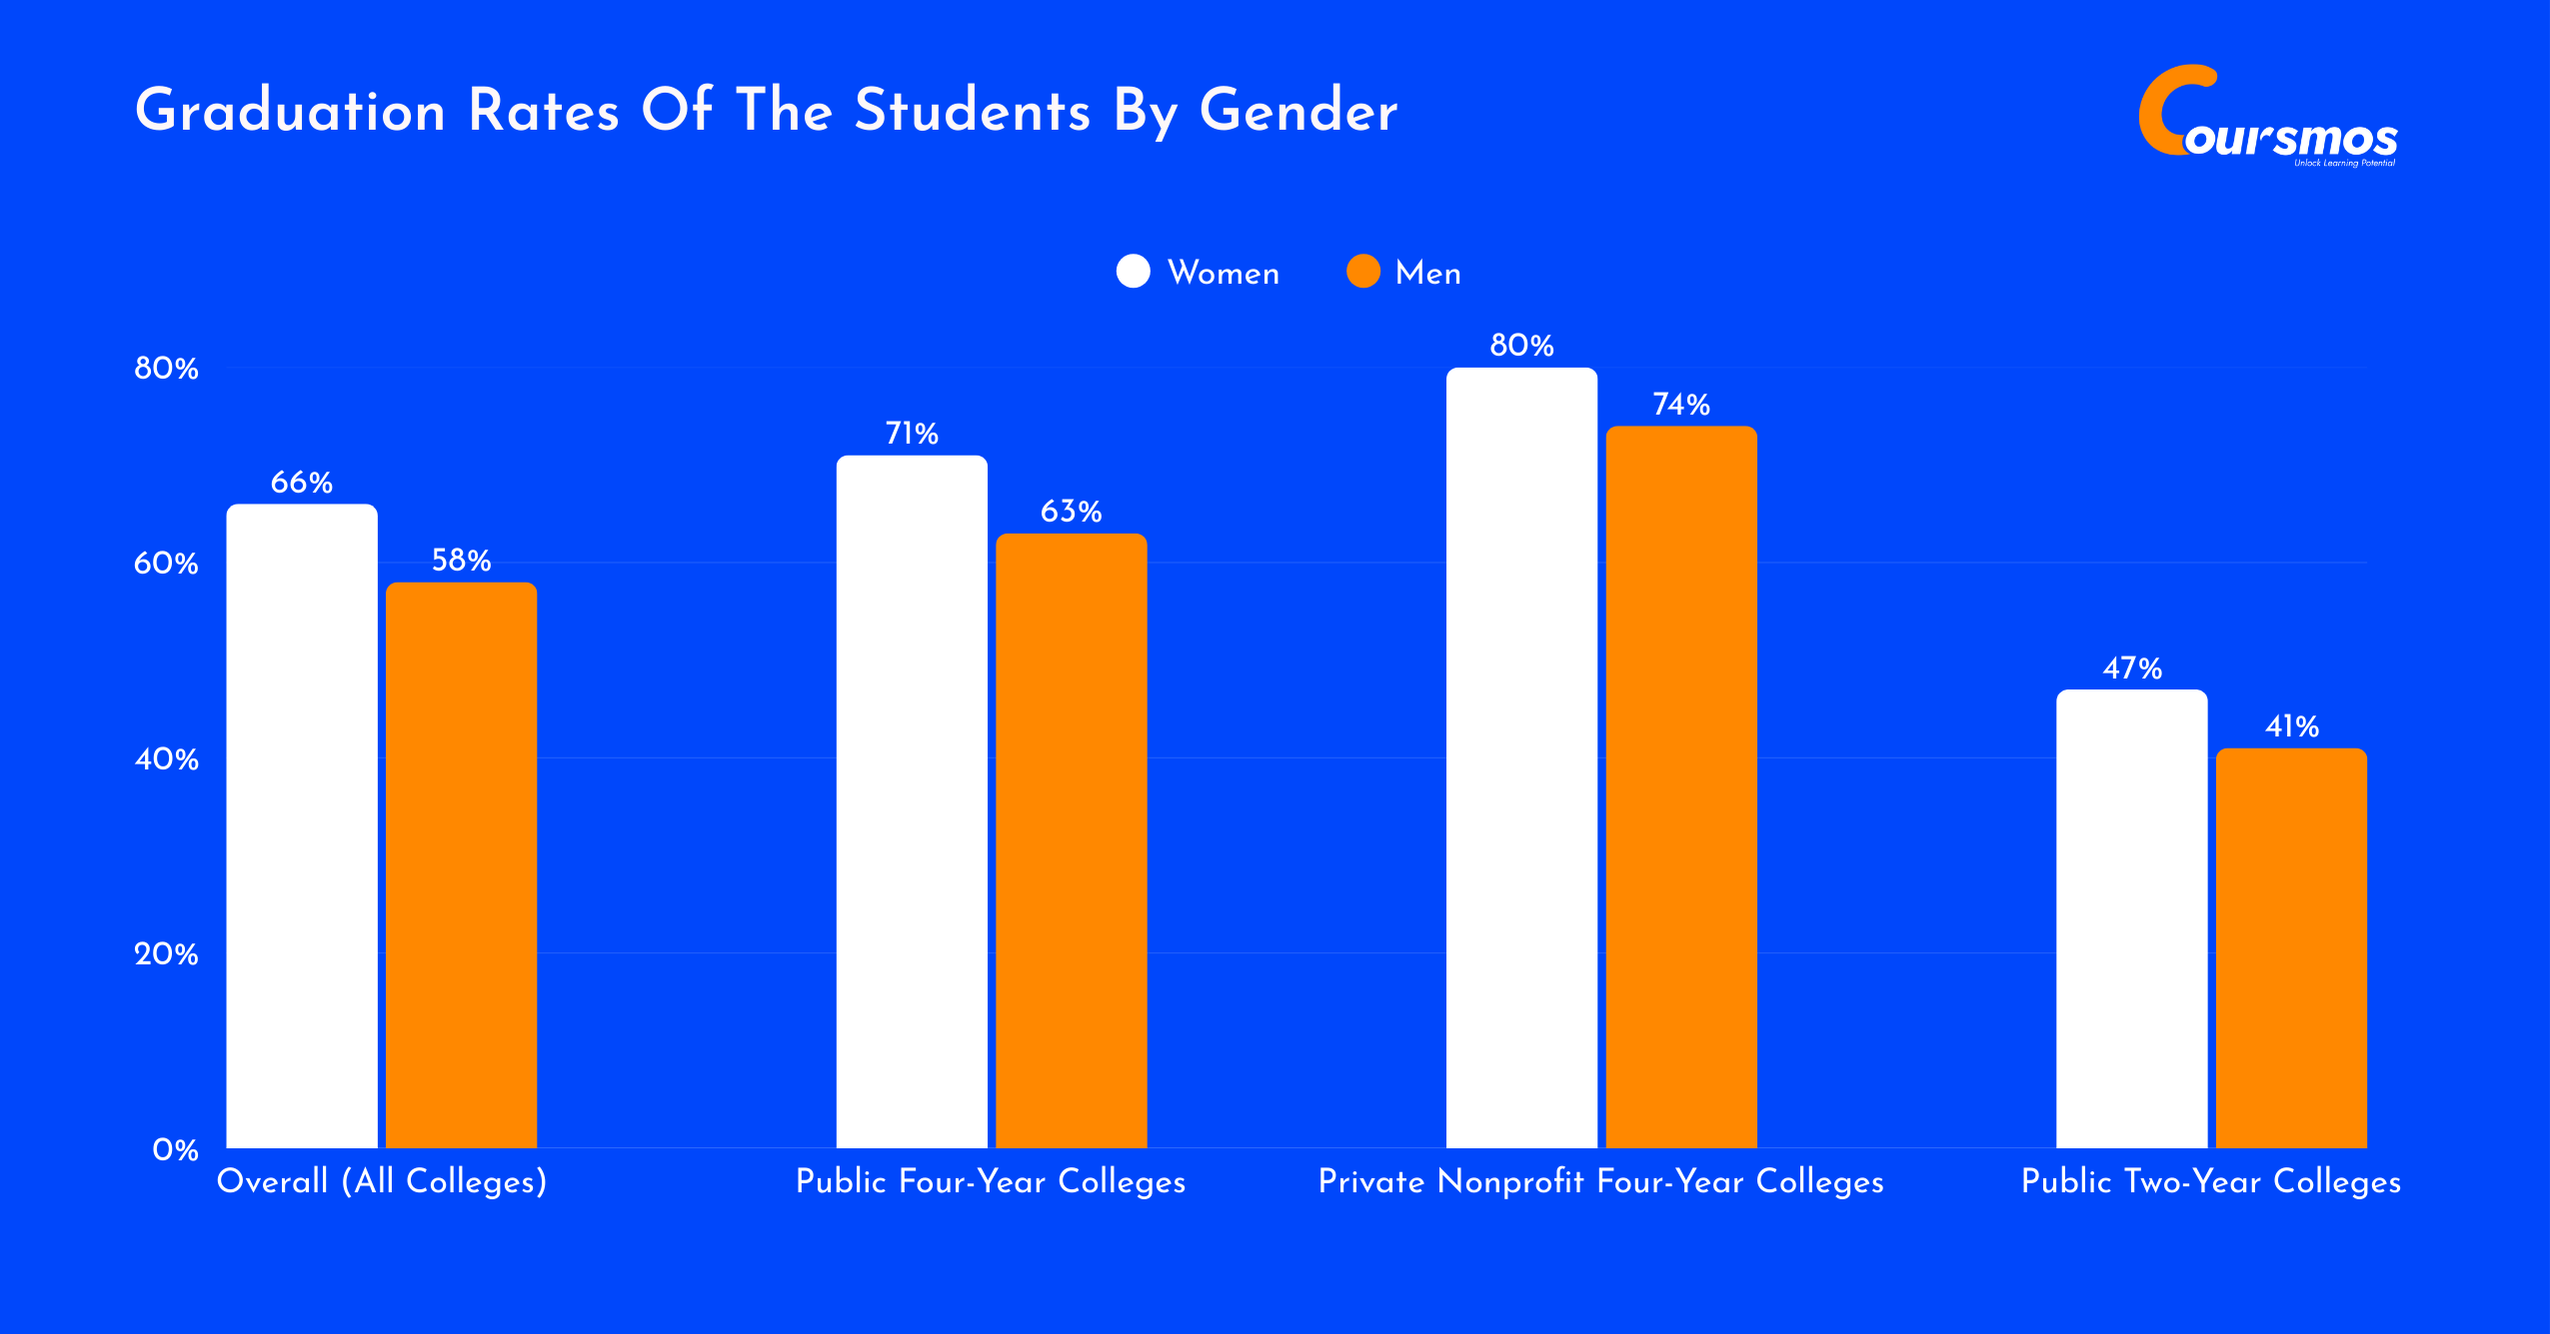
Here is a table displaying the graduation rates of the students by gender recorded in 2023:
| Type of Institution | Women | Men |
|---|---|---|
| Overall (All Colleges) | 66% | 58% |
| Public Four-Year Colleges | 71% | 63% |
| Private Nonprofit Four-Year Colleges | 80% | 74% |
| Public Two-Year Colleges | 47% | 41% |
Source: National Student Clearinghouse Research Center, National Center for Education Statistics.
College Graduates By Age
While most college students fall within the traditional age range of 18 to 24, recent trends show that more adults are heading back to school later in life. Teenagers still make up the majority of college enrollees, with 76.2% of students enrolling as teens.
Among them, 66.9% of those who start a bachelor’s degree at age 18 or younger finish within five years, and 62.2% of those who start at 19 graduate in the same timeframe. These numbers reflect a strong graduation rate among younger students.
However, graduation rates begin to drop significantly among older students. Only 22% of students who enroll between the ages of 20 and 23 complete their degree within five years. The rate falls even further for those aged 24 to 29, with just 8.4% graduating in that time.
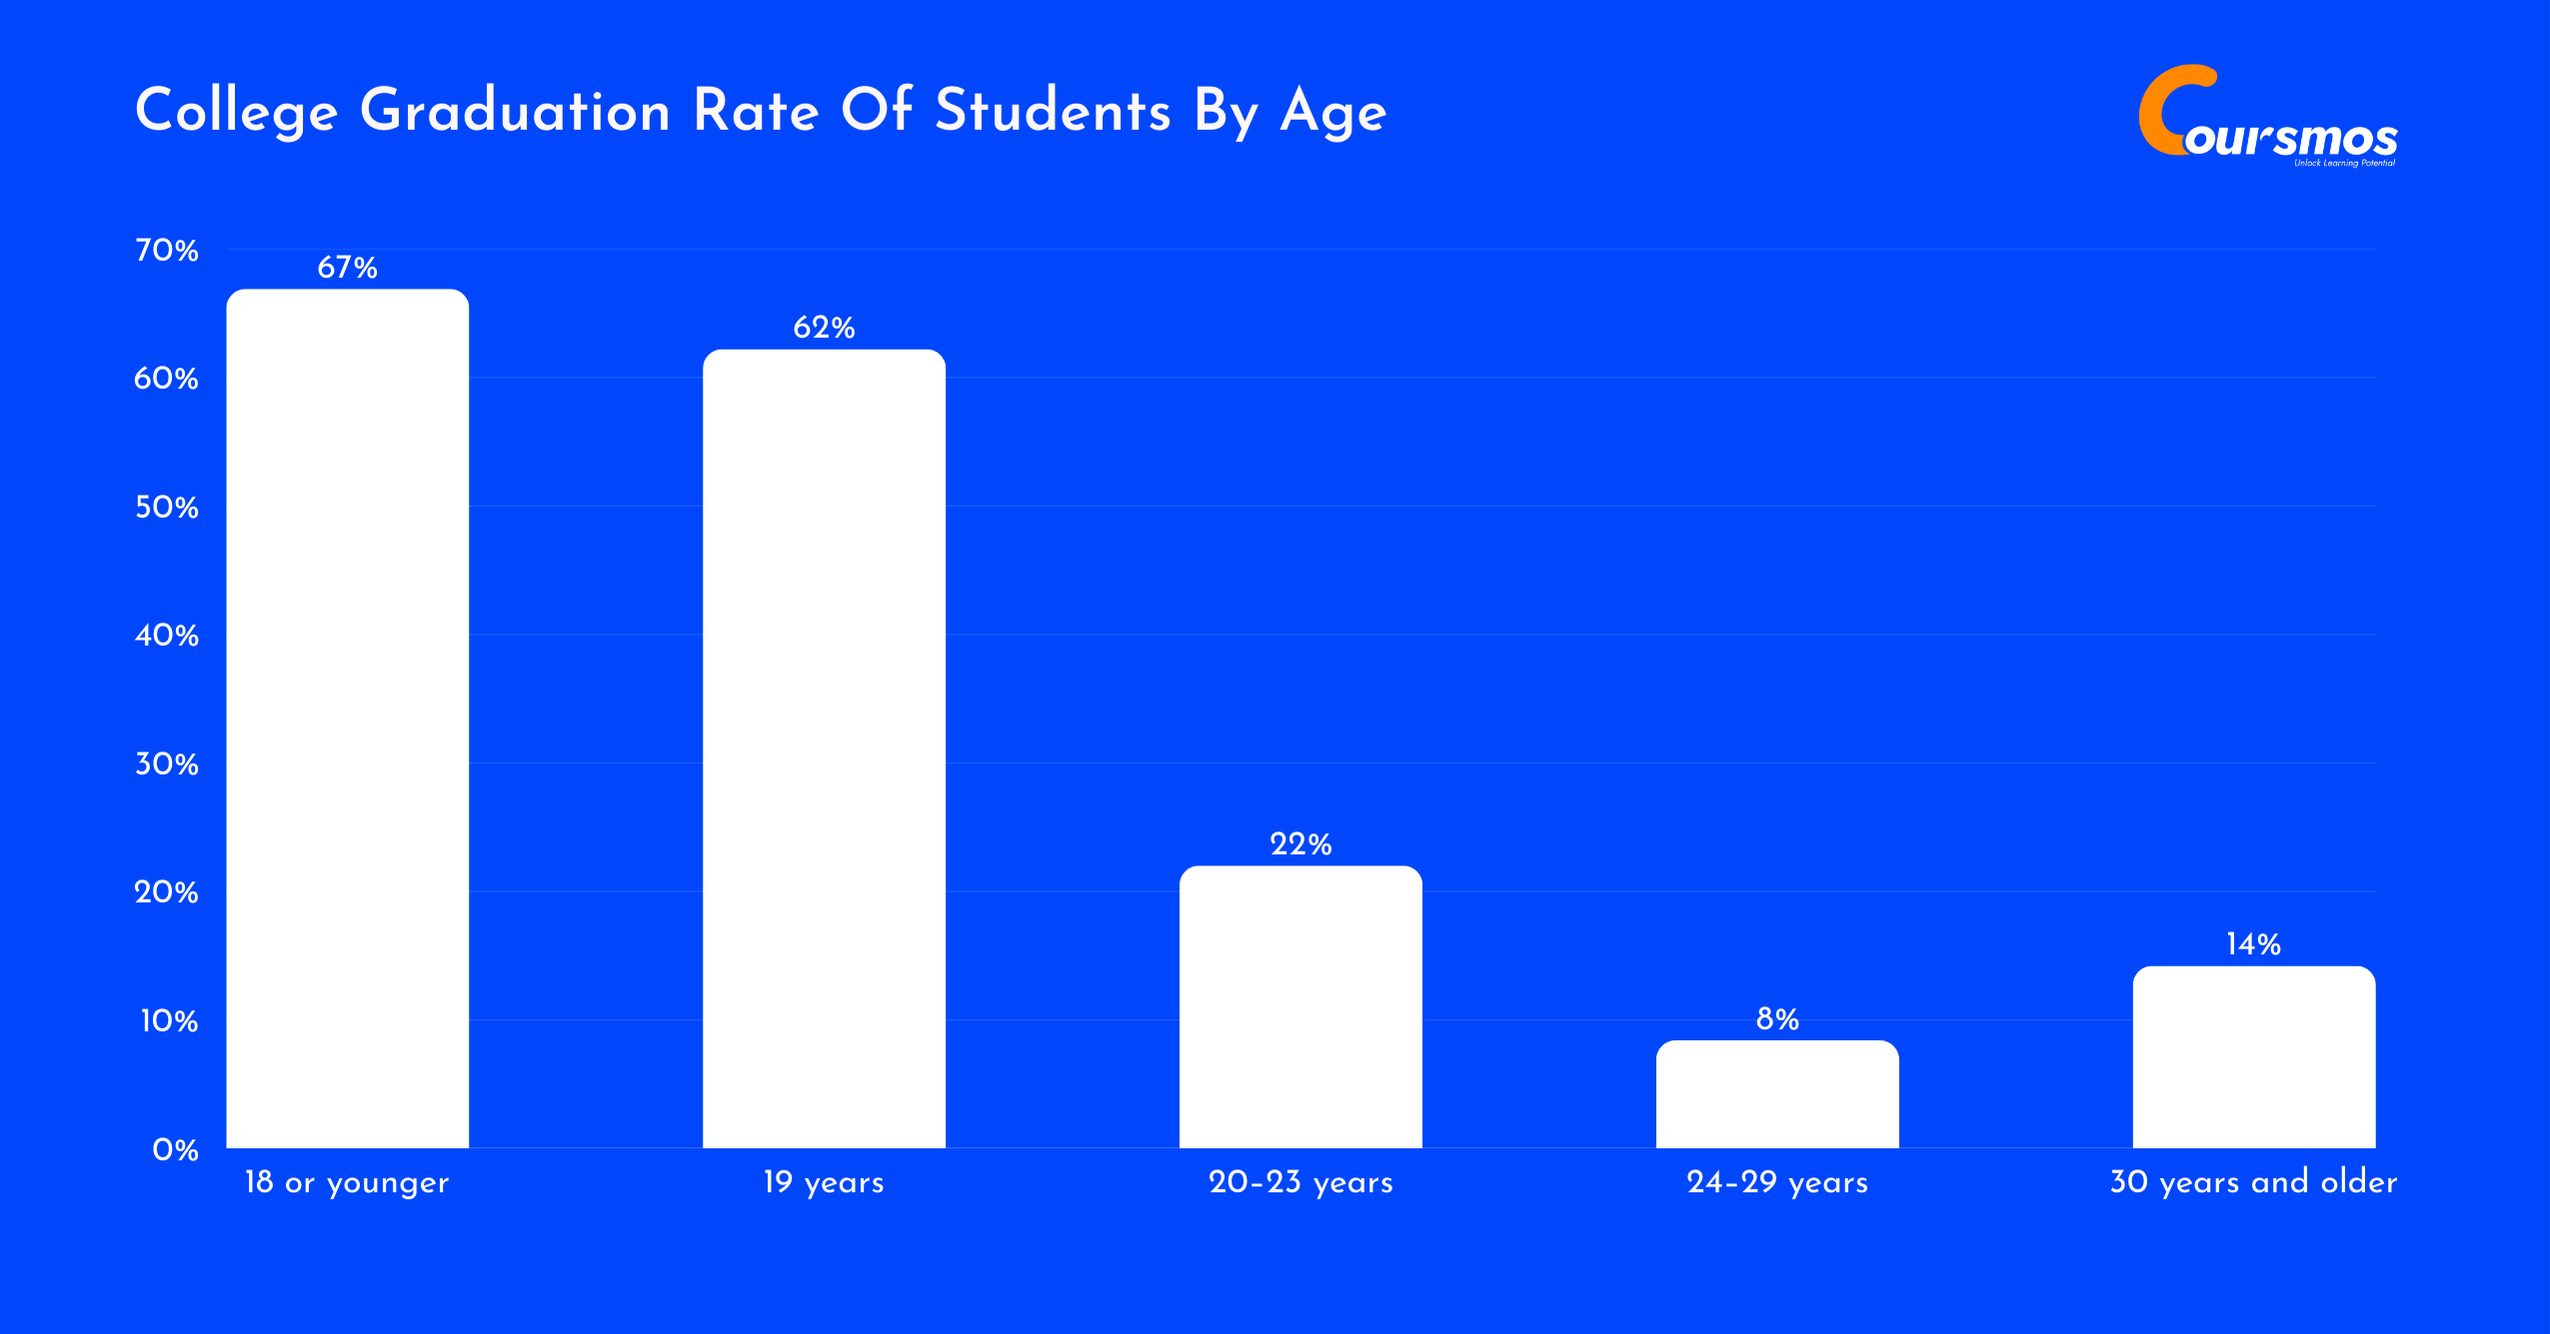
Here is a table displaying the college graduation rate of students by age:
| Age Group | Graduation Rate (within 5 years) |
|---|---|
| 18 or younger | 66.9% |
| 19 years | 62.2% |
| 20–23 years | 22.0% |
| 24–29 years | 8.4% |
| 30 years and older | 14.2% |
Source: Education Data
College Graduates By Race Or Ethnicity
Graduation rates within five years for bachelor’s students vary significantly by race and ethnicity, from 74.8% for Asian/Pacific Islander students to just 42.6% for Black or African American students.
Asian and Pacific Islander students top the list, showing they’re most likely to complete their degrees on time, followed by White students at 65.6%.
In contrast, Black and African American students have the lowest graduation rate, revealing that despite ongoing progress, equity gaps in higher education still need serious attention.
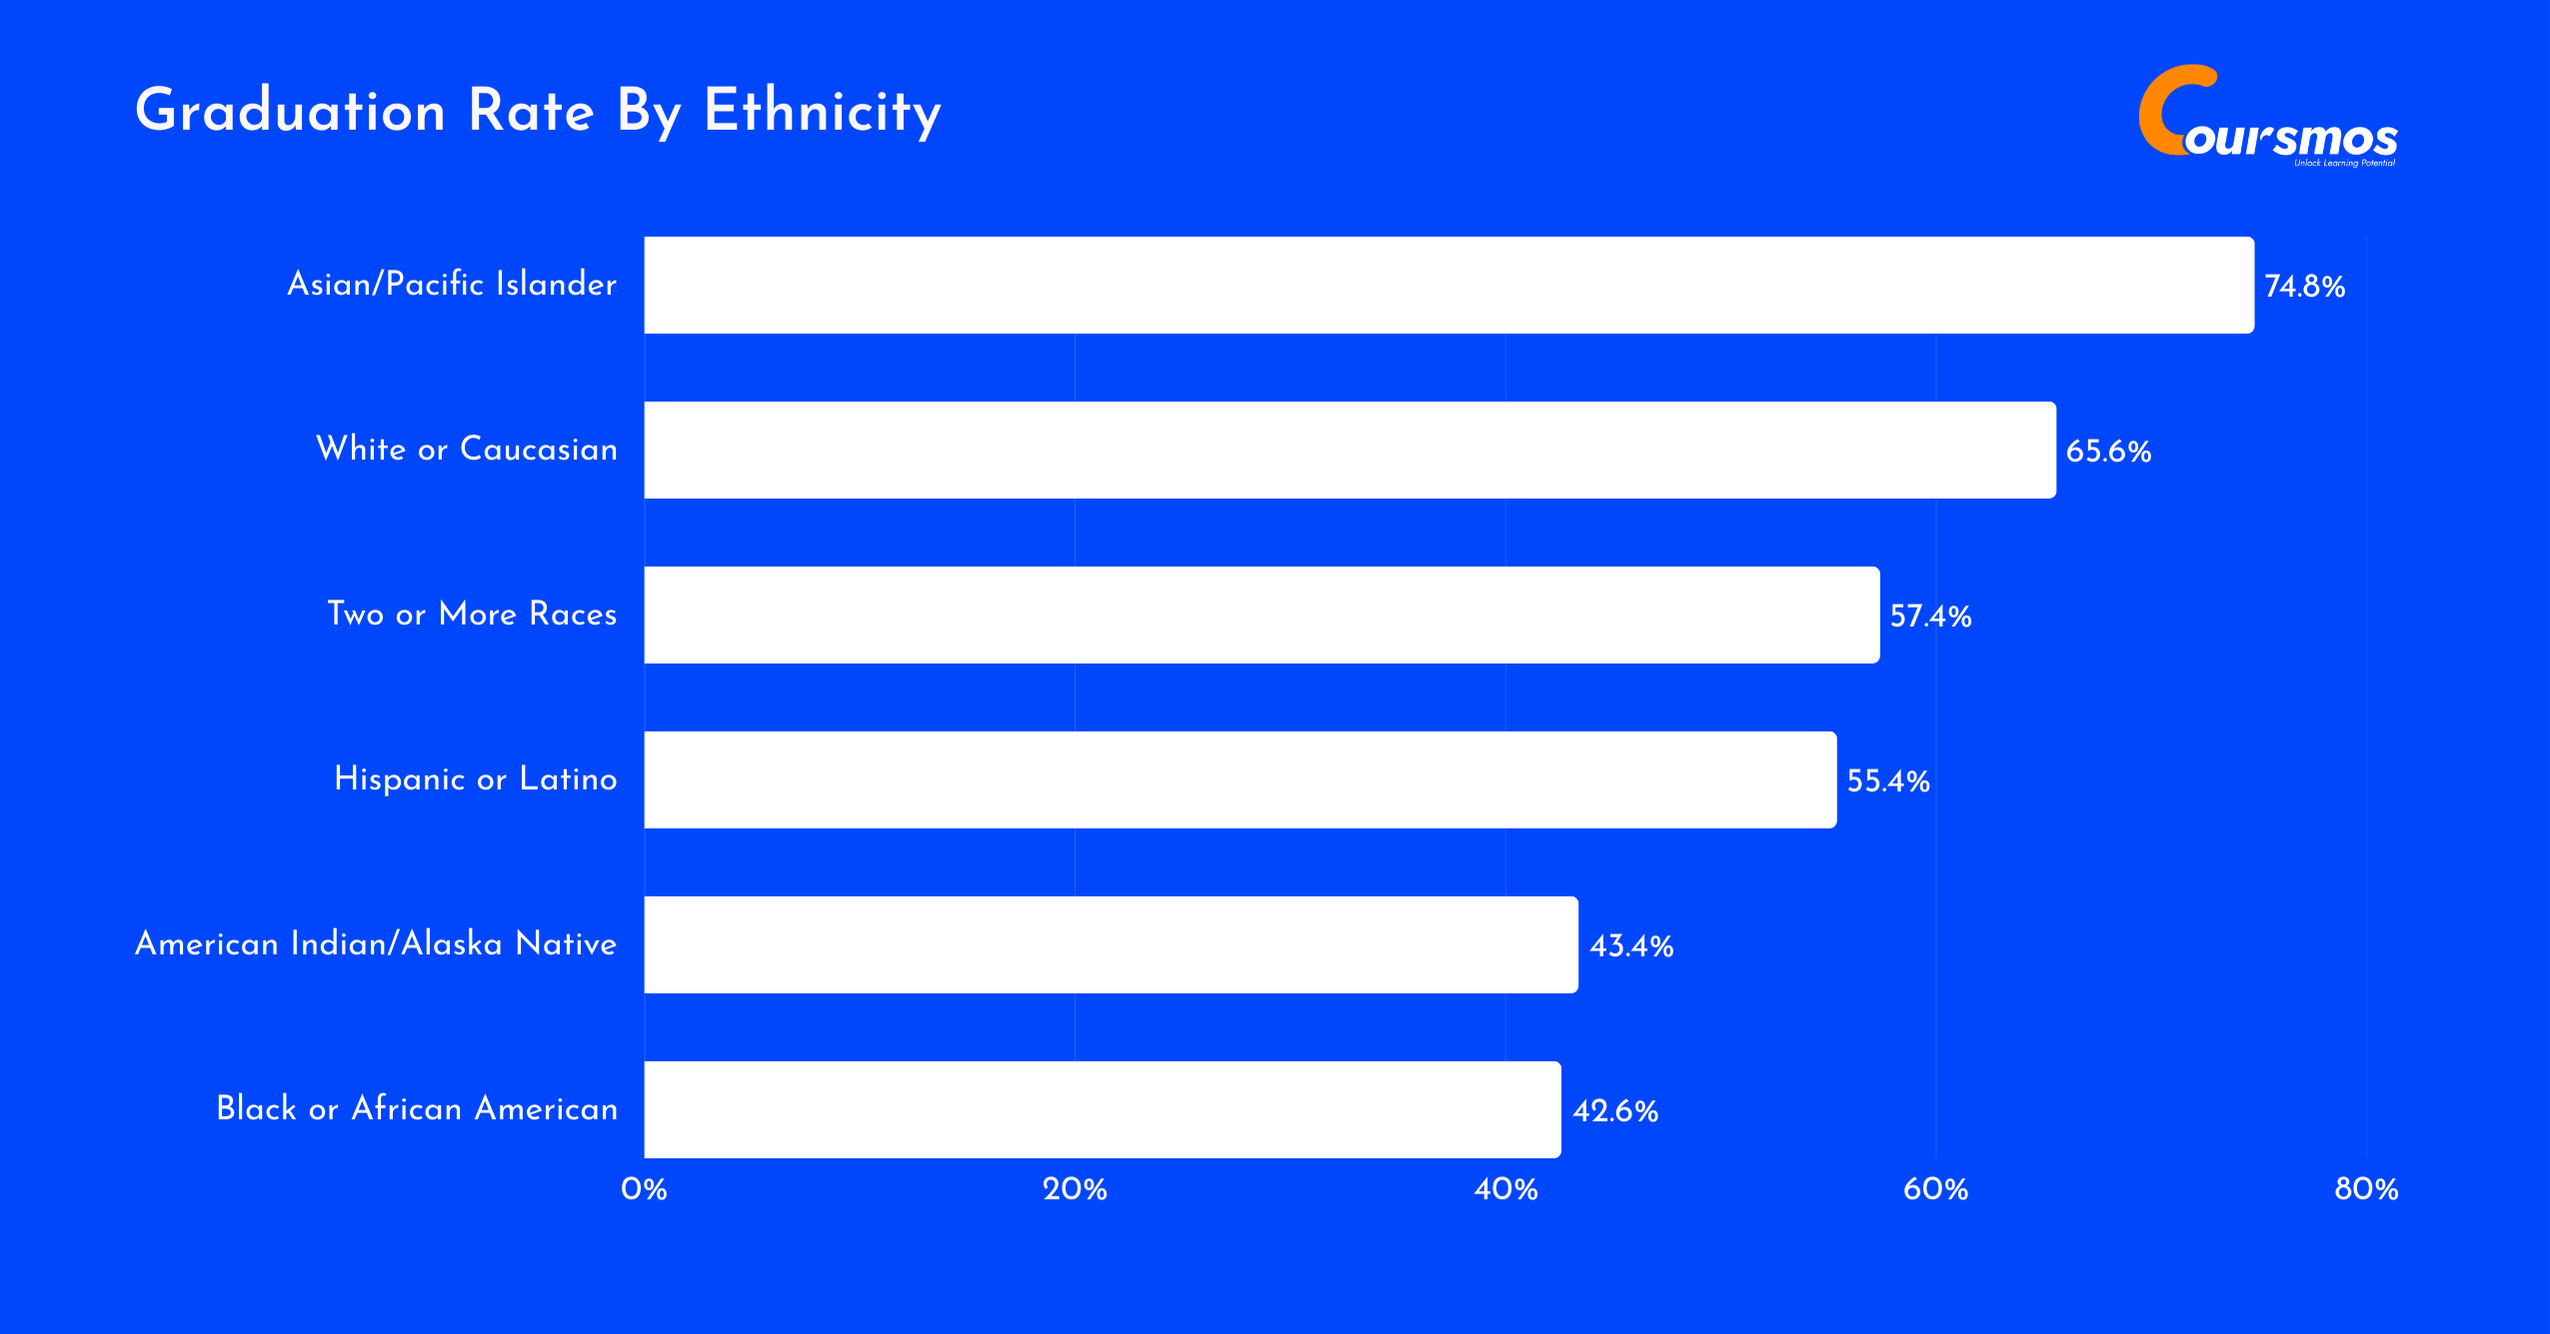
Here is a table displaying the graduation rates within five years for bachelor’s students:
| Race/Ethnicity | 5-Year Graduation Rate (Bachelor’s) |
|---|---|
| Asian/Pacific Islander | 74.8% |
| White or Caucasian | 65.6% |
| Two or More Races | 57.4% |
| Hispanic or Latino | 55.4% |
| American Indian/Alaska Native | 43.4% |
| Black or African American | 42.6% |
Source: Education Data
American Indian/Alaska Native Students’ Graduation Rate
Among American Indian/Alaska Native students, most earned associate’s or bachelor’s degrees, while less than 4% completed a doctorate or professional program, making up just 0.5% of all U.S. graduates overall.
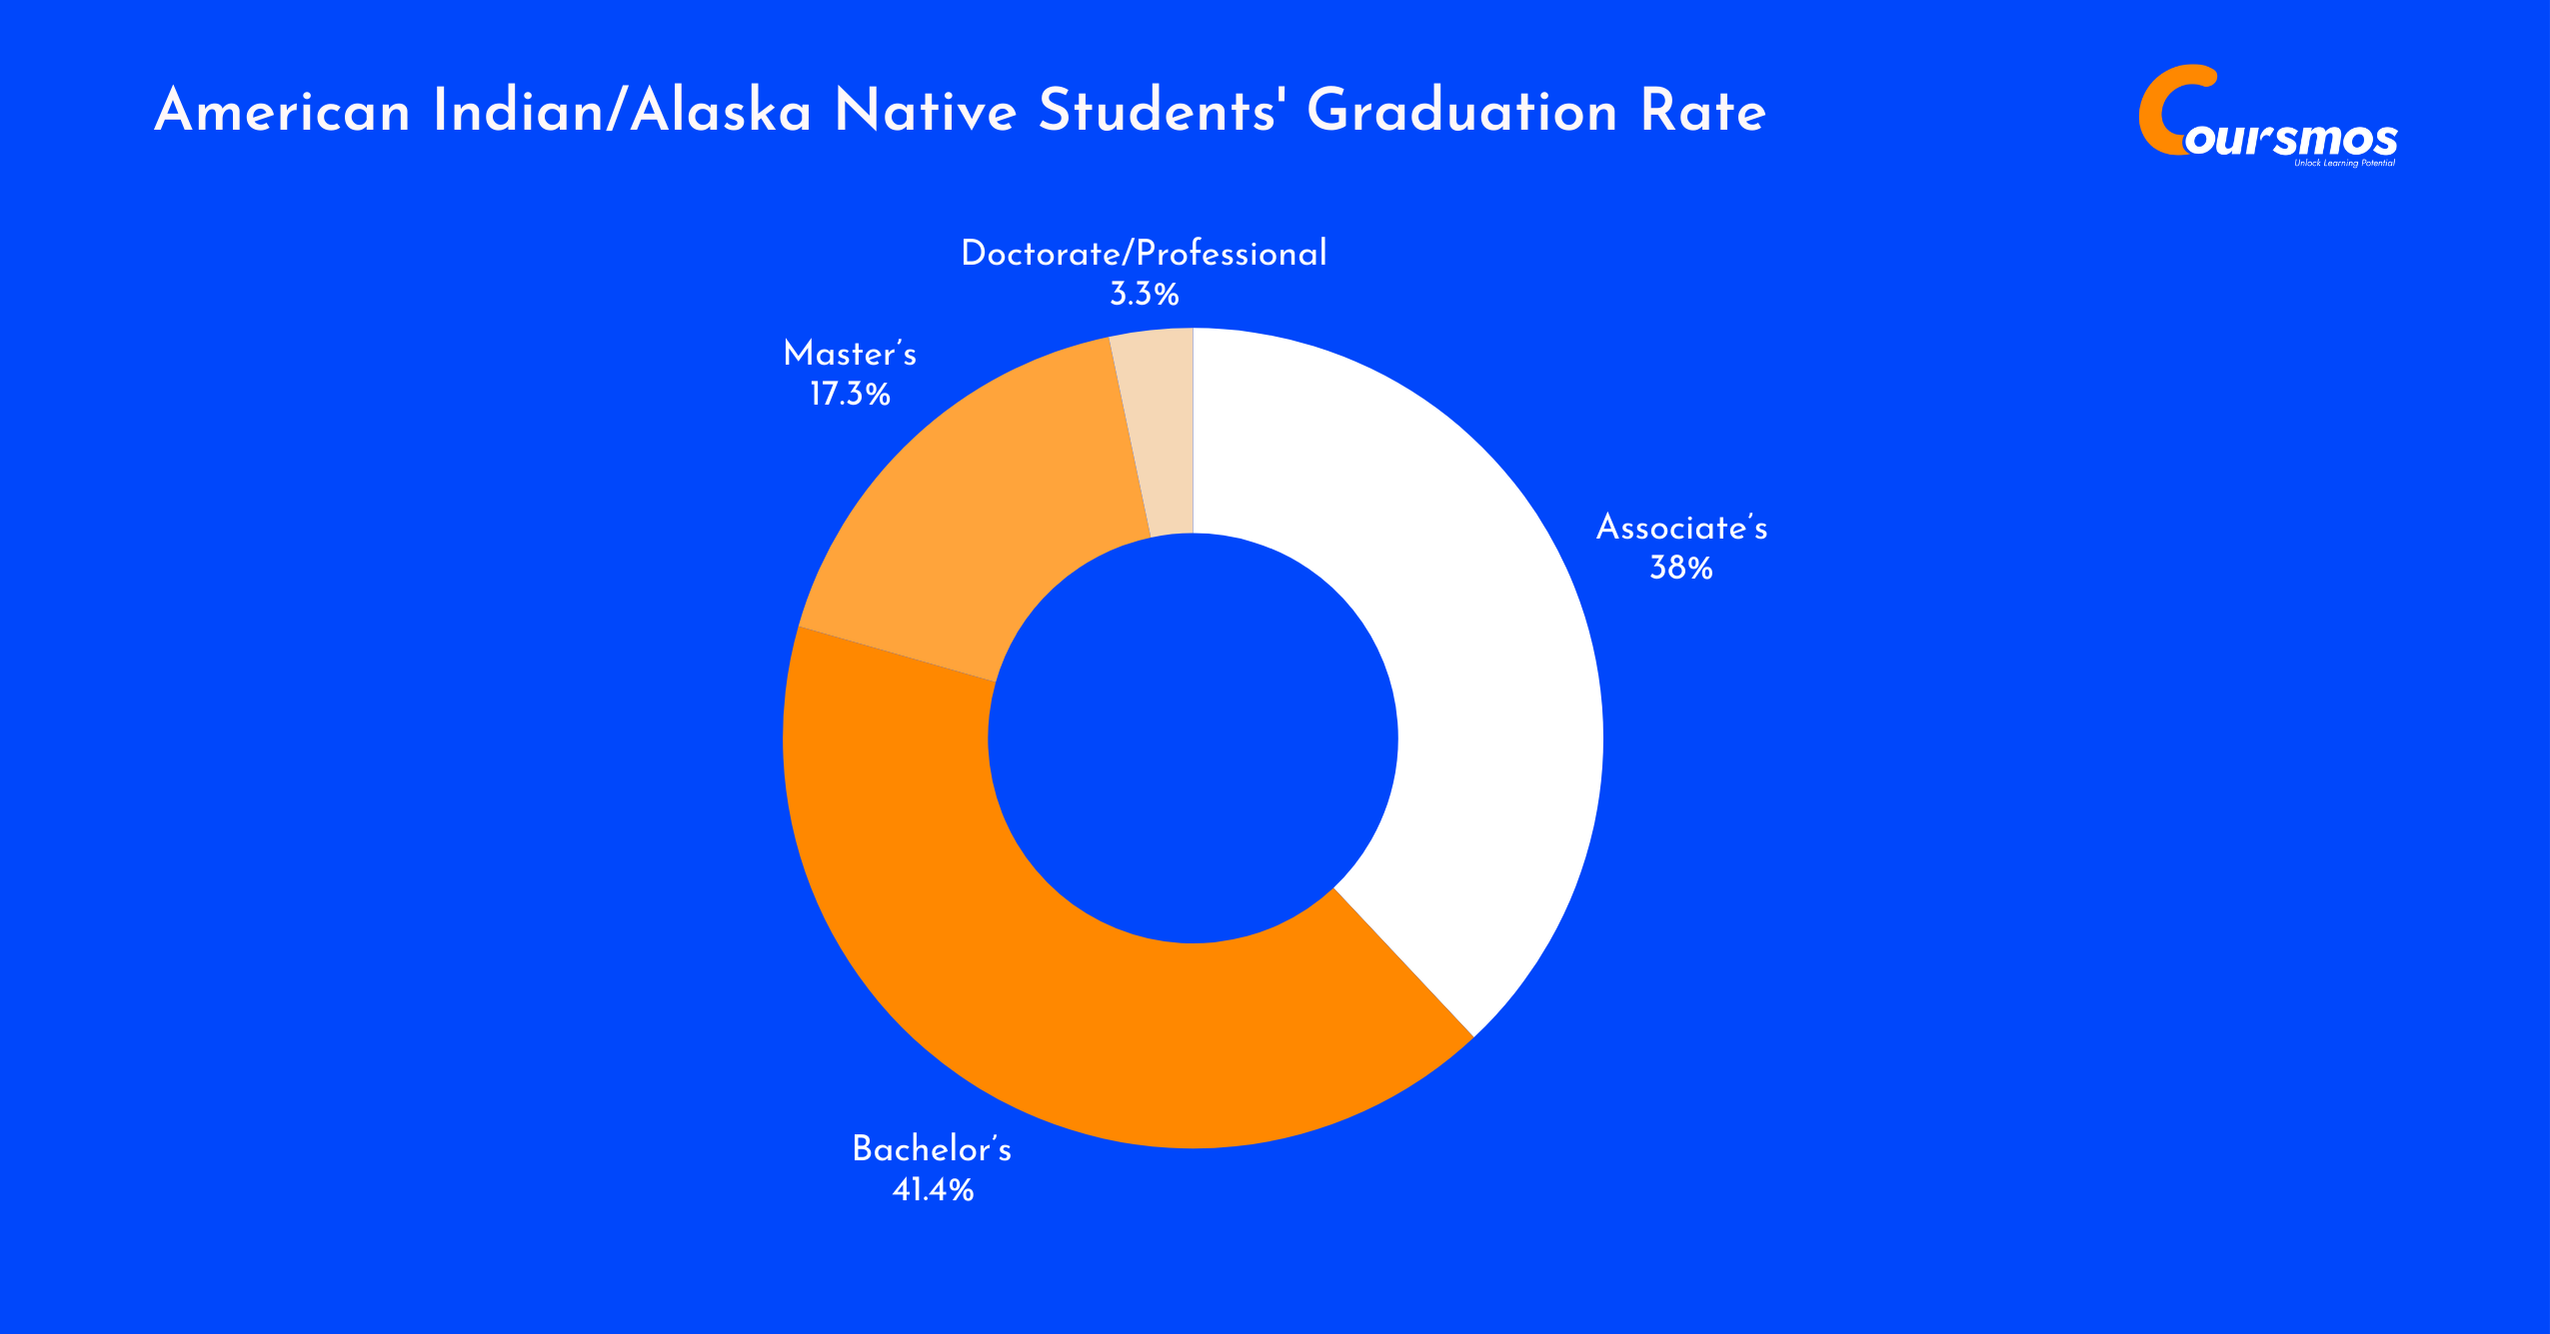
| Degree Level | Graduates | Share Within Group | Share |
|---|---|---|---|
| Associate’s | 8,170 | 38.0% | 0.8% |
| Bachelor’s | 8,910 | 41.4% | 0.4% |
| Master’s | 3,720 | 17.3% | 0.4% |
| Doctorate/Professional | 720 | 3.4% | 0.4% |
| Total Graduates | 21,530 | 100% | 0.5% |
Asian/Pacific Islander Students’ Graduation Rate
Asian/Pacific Islander students made up 8% of all U.S. college graduates, with the majority (53%) earning bachelor’s degrees.
They had the highest share of doctorate/professional degrees (11.2%) compared to other groups.
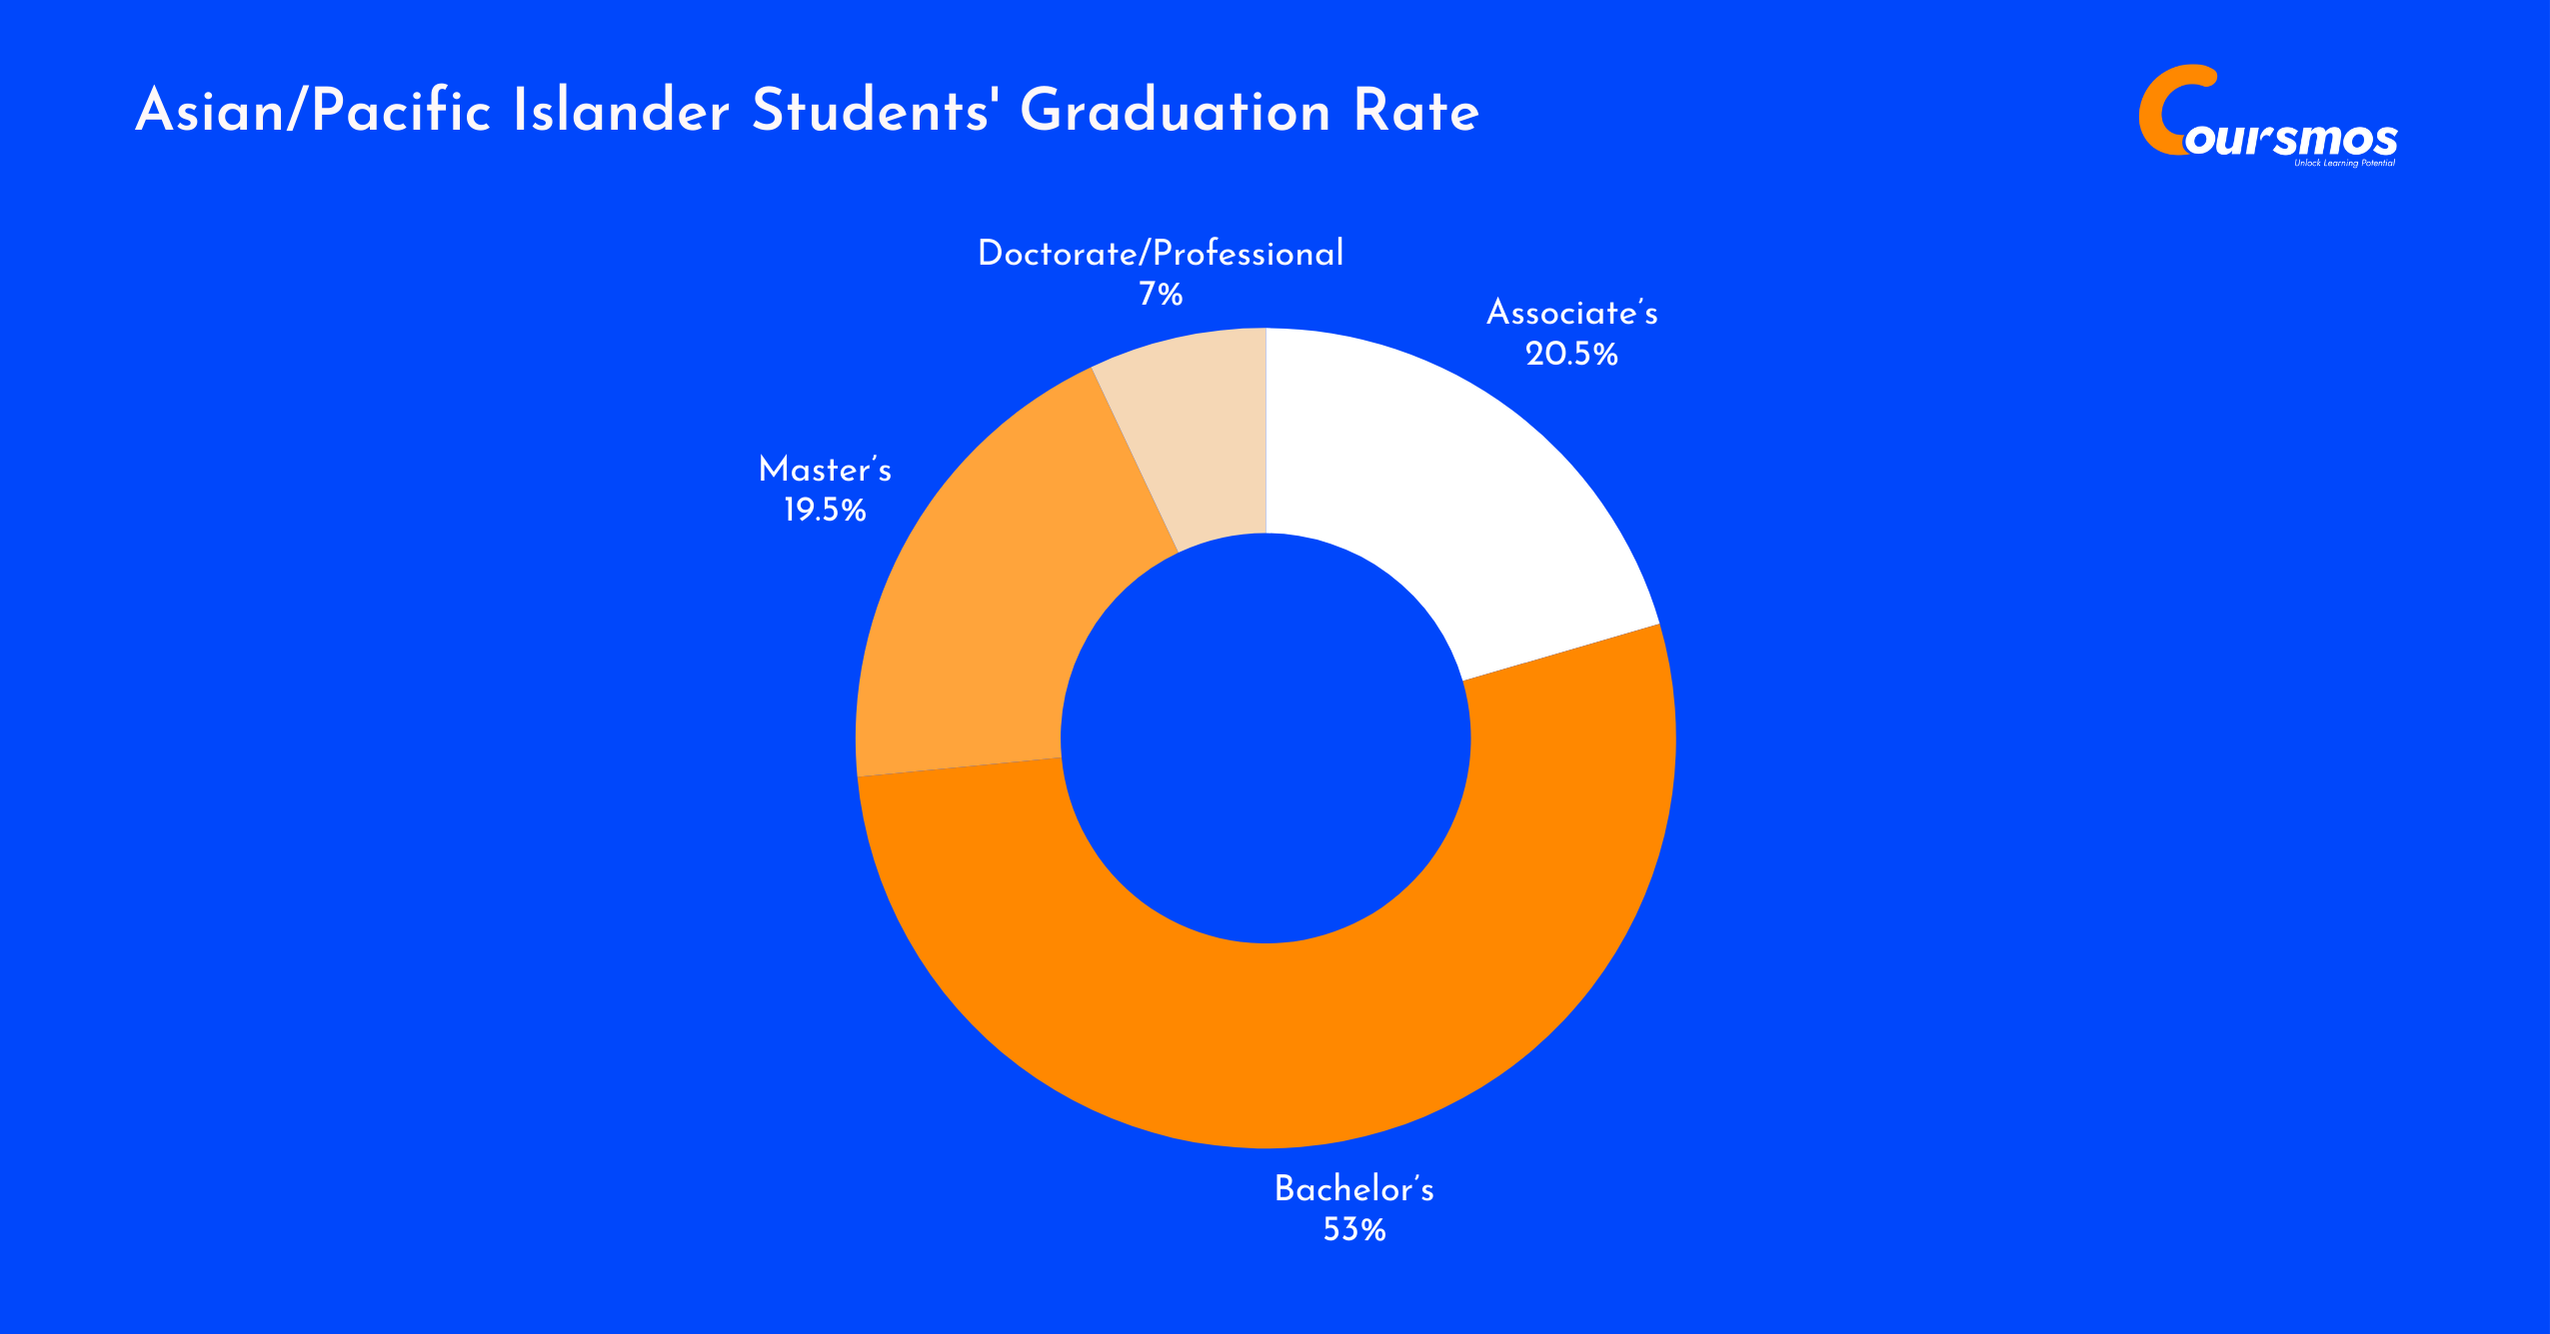
| Degree Level | Graduates | Share Within Group | Share of All Graduates |
|---|---|---|---|
| Associate’s | 67,580 | 20.5% | 6.7% |
| Bachelor’s | 174,600 | 53.0% | 8.7% |
| Master’s | 64,140 | 19.5% | 7.3% |
| Doctorate/Professional | 22,850 | 6.9% | 11.2% |
| Total Graduates | 329,170 | 100% | 8.0% |
Black or African American Students’ Graduation Rate
Black students made up 10.7% of all U.S. college graduates, with 45.5% earning bachelor’s degrees, making it the most common degree among the group.
Notably, they also held a strong share in associate (27.7%) and master’s degrees (22.6%). However, only 4.2% pursued doctorate or professional programs, showing a lower presence at the highest academic level compared to their representation in undergraduate education.

| Degree Level | Graduates | Share | Share |
|---|---|---|---|
| Associate’s | 121,610 | 27.7% | 12.1% |
| Bachelor’s | 199,960 | 45.5% | 9.9% |
| Master’s | 99,070 | 22.6% | 11.3% |
| Doctorate/Professional | 18,490 | 4.2% | 9.1% |
| Total Graduates | 439,130 | 100% | 10.7% |
Hispanic or Latino Students’ Graduation Rate
Hispanic students accounted for 17.3% of all college graduates, making them one of the fastest-growing groups in higher education.
The largest portion, 46%, earned bachelor’s degrees, followed closely by 37.3% who completed associate’s degrees. While graduate-level participation is lower, they still made up 11.5% of all master’s degrees — a promising sign of academic progression.
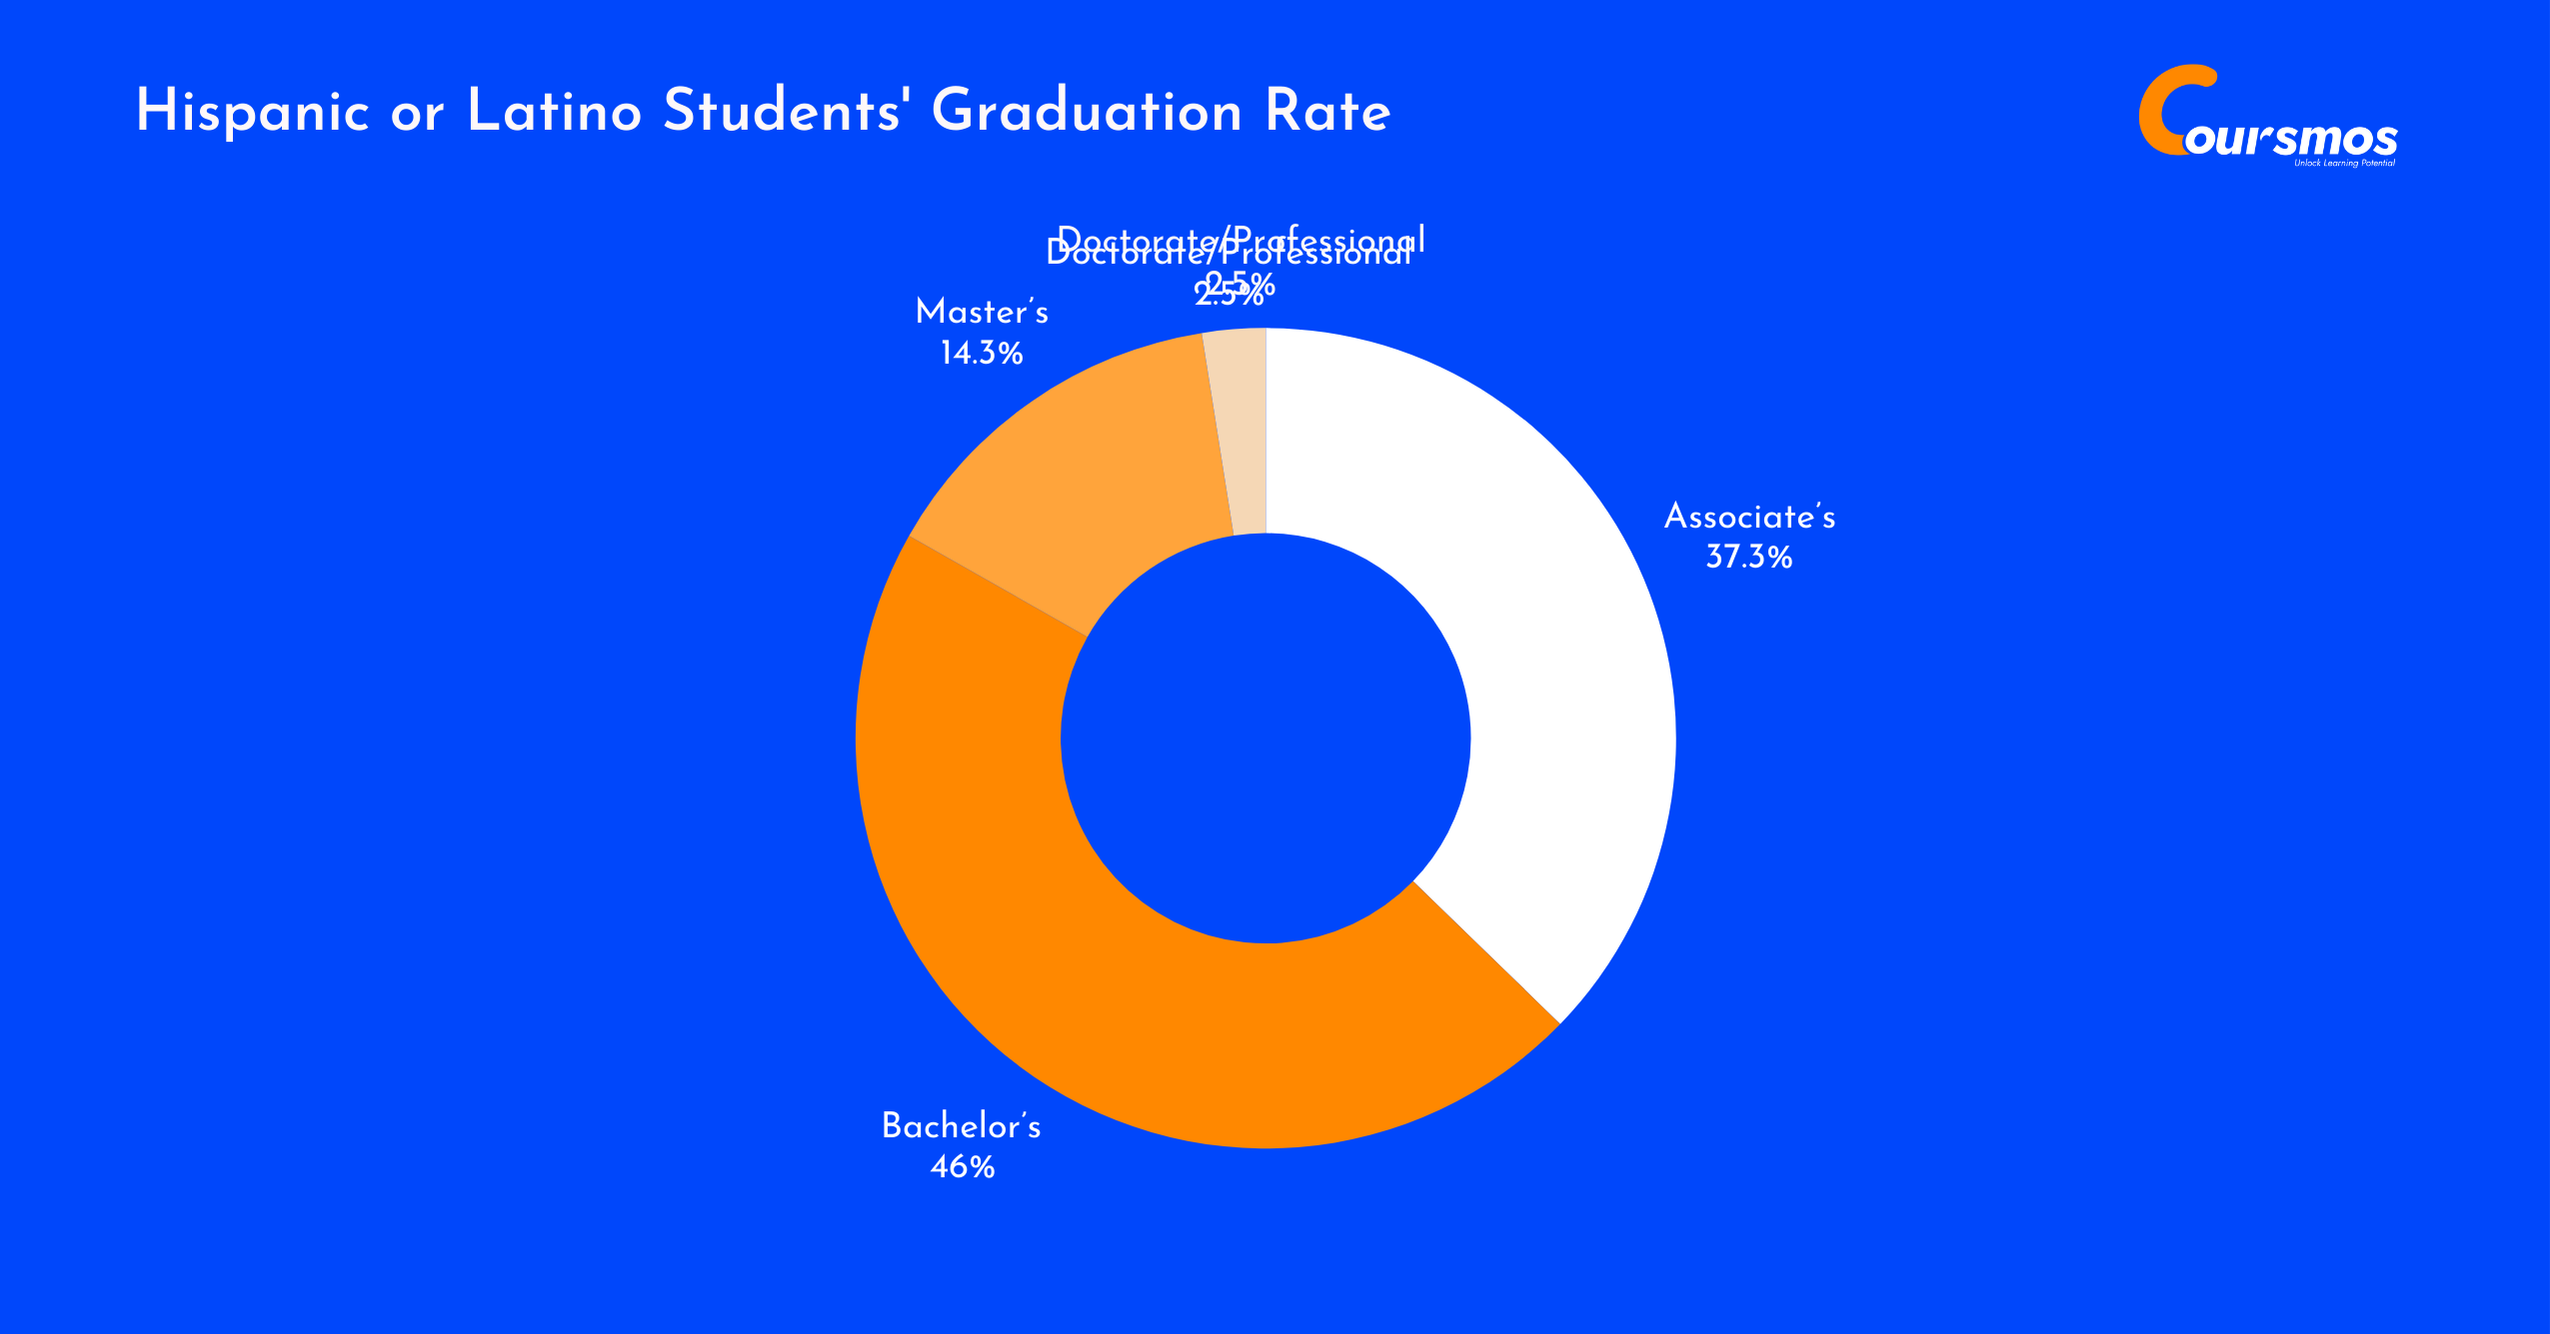
| Degree Level | Graduates | Share Within Group | Share of All Graduates |
|---|---|---|---|
| Associate’s | 264,300 | 37.3% | 26.2% |
| Bachelor’s | 325,930 | 46.0% | 16.2% |
| Master’s | 101,340 | 14.3% | 11.5% |
| Doctorate/Professional | 17,660 | 2.5% | 8.7% |
| Total Graduates | 709,240 | 100% | 17.3% |
White Or Caucasian Students’ Graduation Rate
White students continue to represent the majority of college graduates, making up 53.6% of the total.
Over half (51.3%) earned bachelor’s degrees, while 21.4% completed master’s programs — the highest total number among all groups. They also held the largest share across all degree levels, especially at the doctorate/professional level (55.2%), highlighting their strong representation in higher education pathways.
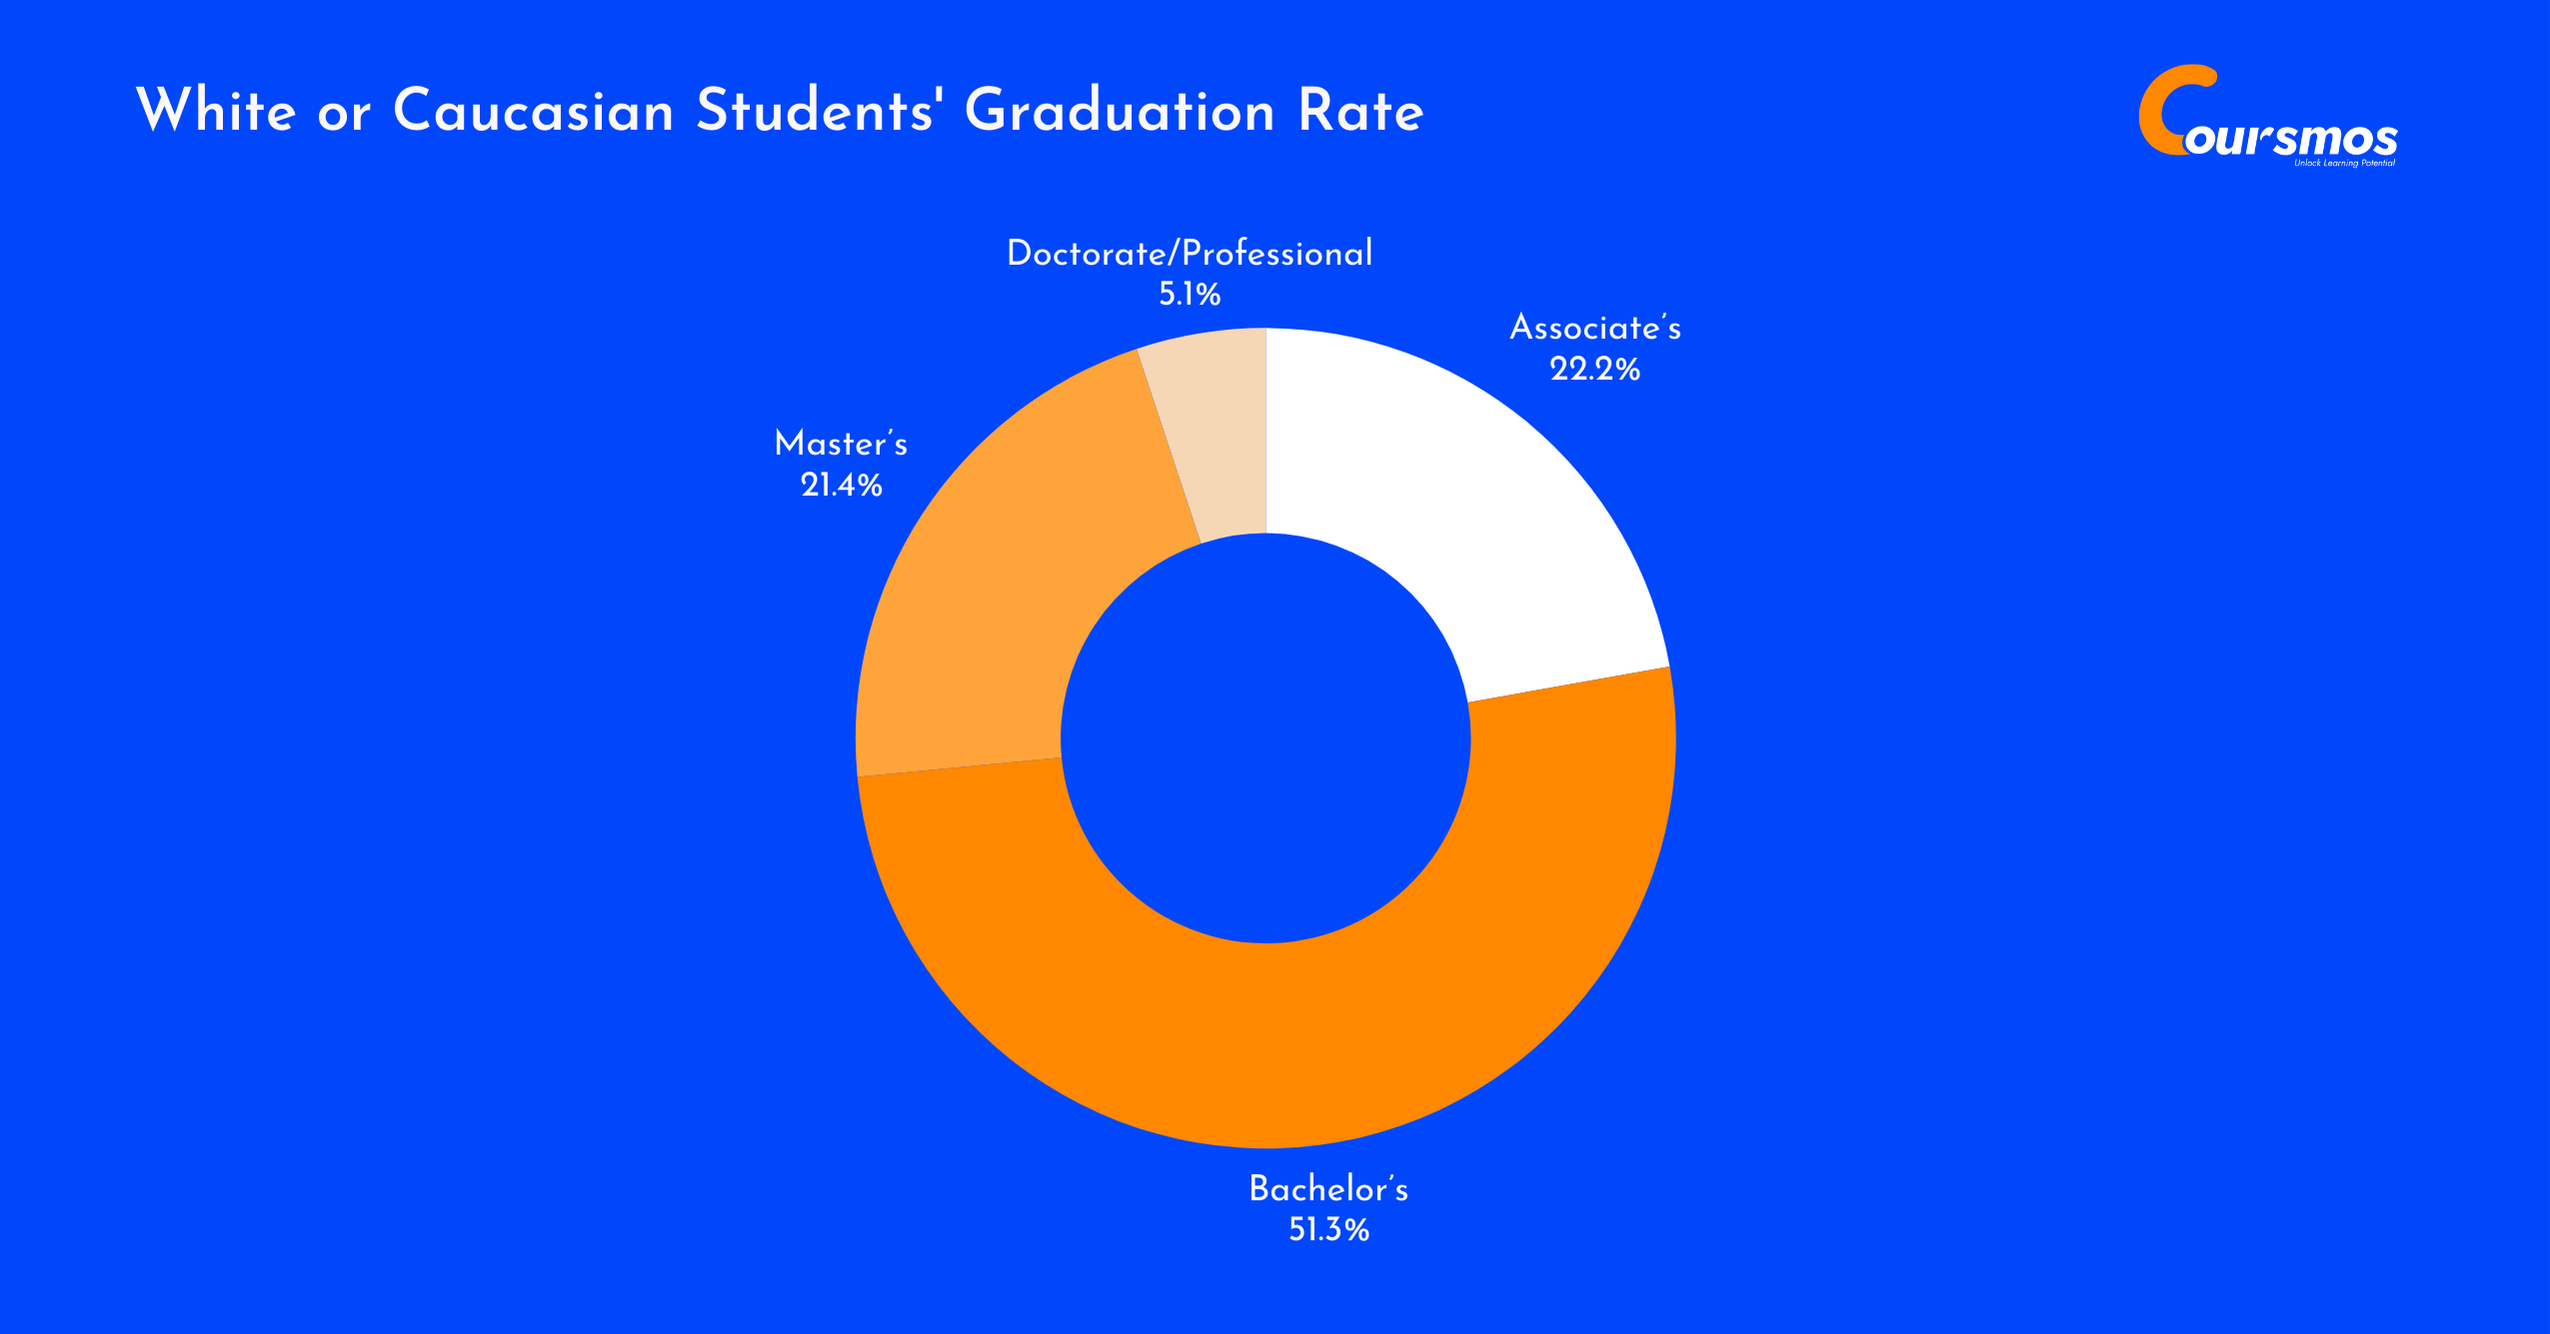
| Degree Level | Graduates | Share Within Group | Share of All Graduates |
|---|---|---|---|
| Associate’s | 488,070 | 22.2% | 48.4% |
| Bachelor’s | 1,130,000 | 51.3% | 56.1% |
| Master’s | 470,780 | 21.4% | 53.5% |
| Doctorate/Professional | 112,600 | 5.1% | 55.2% |
| Total Graduates | 2,201,020 | 100% | 53.6% |
Students Of Two Or More Races Graduation Rate
Students identifying as two or more races made up 3.7% of all graduates.
A significant 53.4% earned bachelor’s degrees, while 26.2% completed associate’s degrees. Their presence in graduate programs was modest, with only 4.1% earning doctorate/professional degrees, reflecting potential growth opportunities in advanced education.
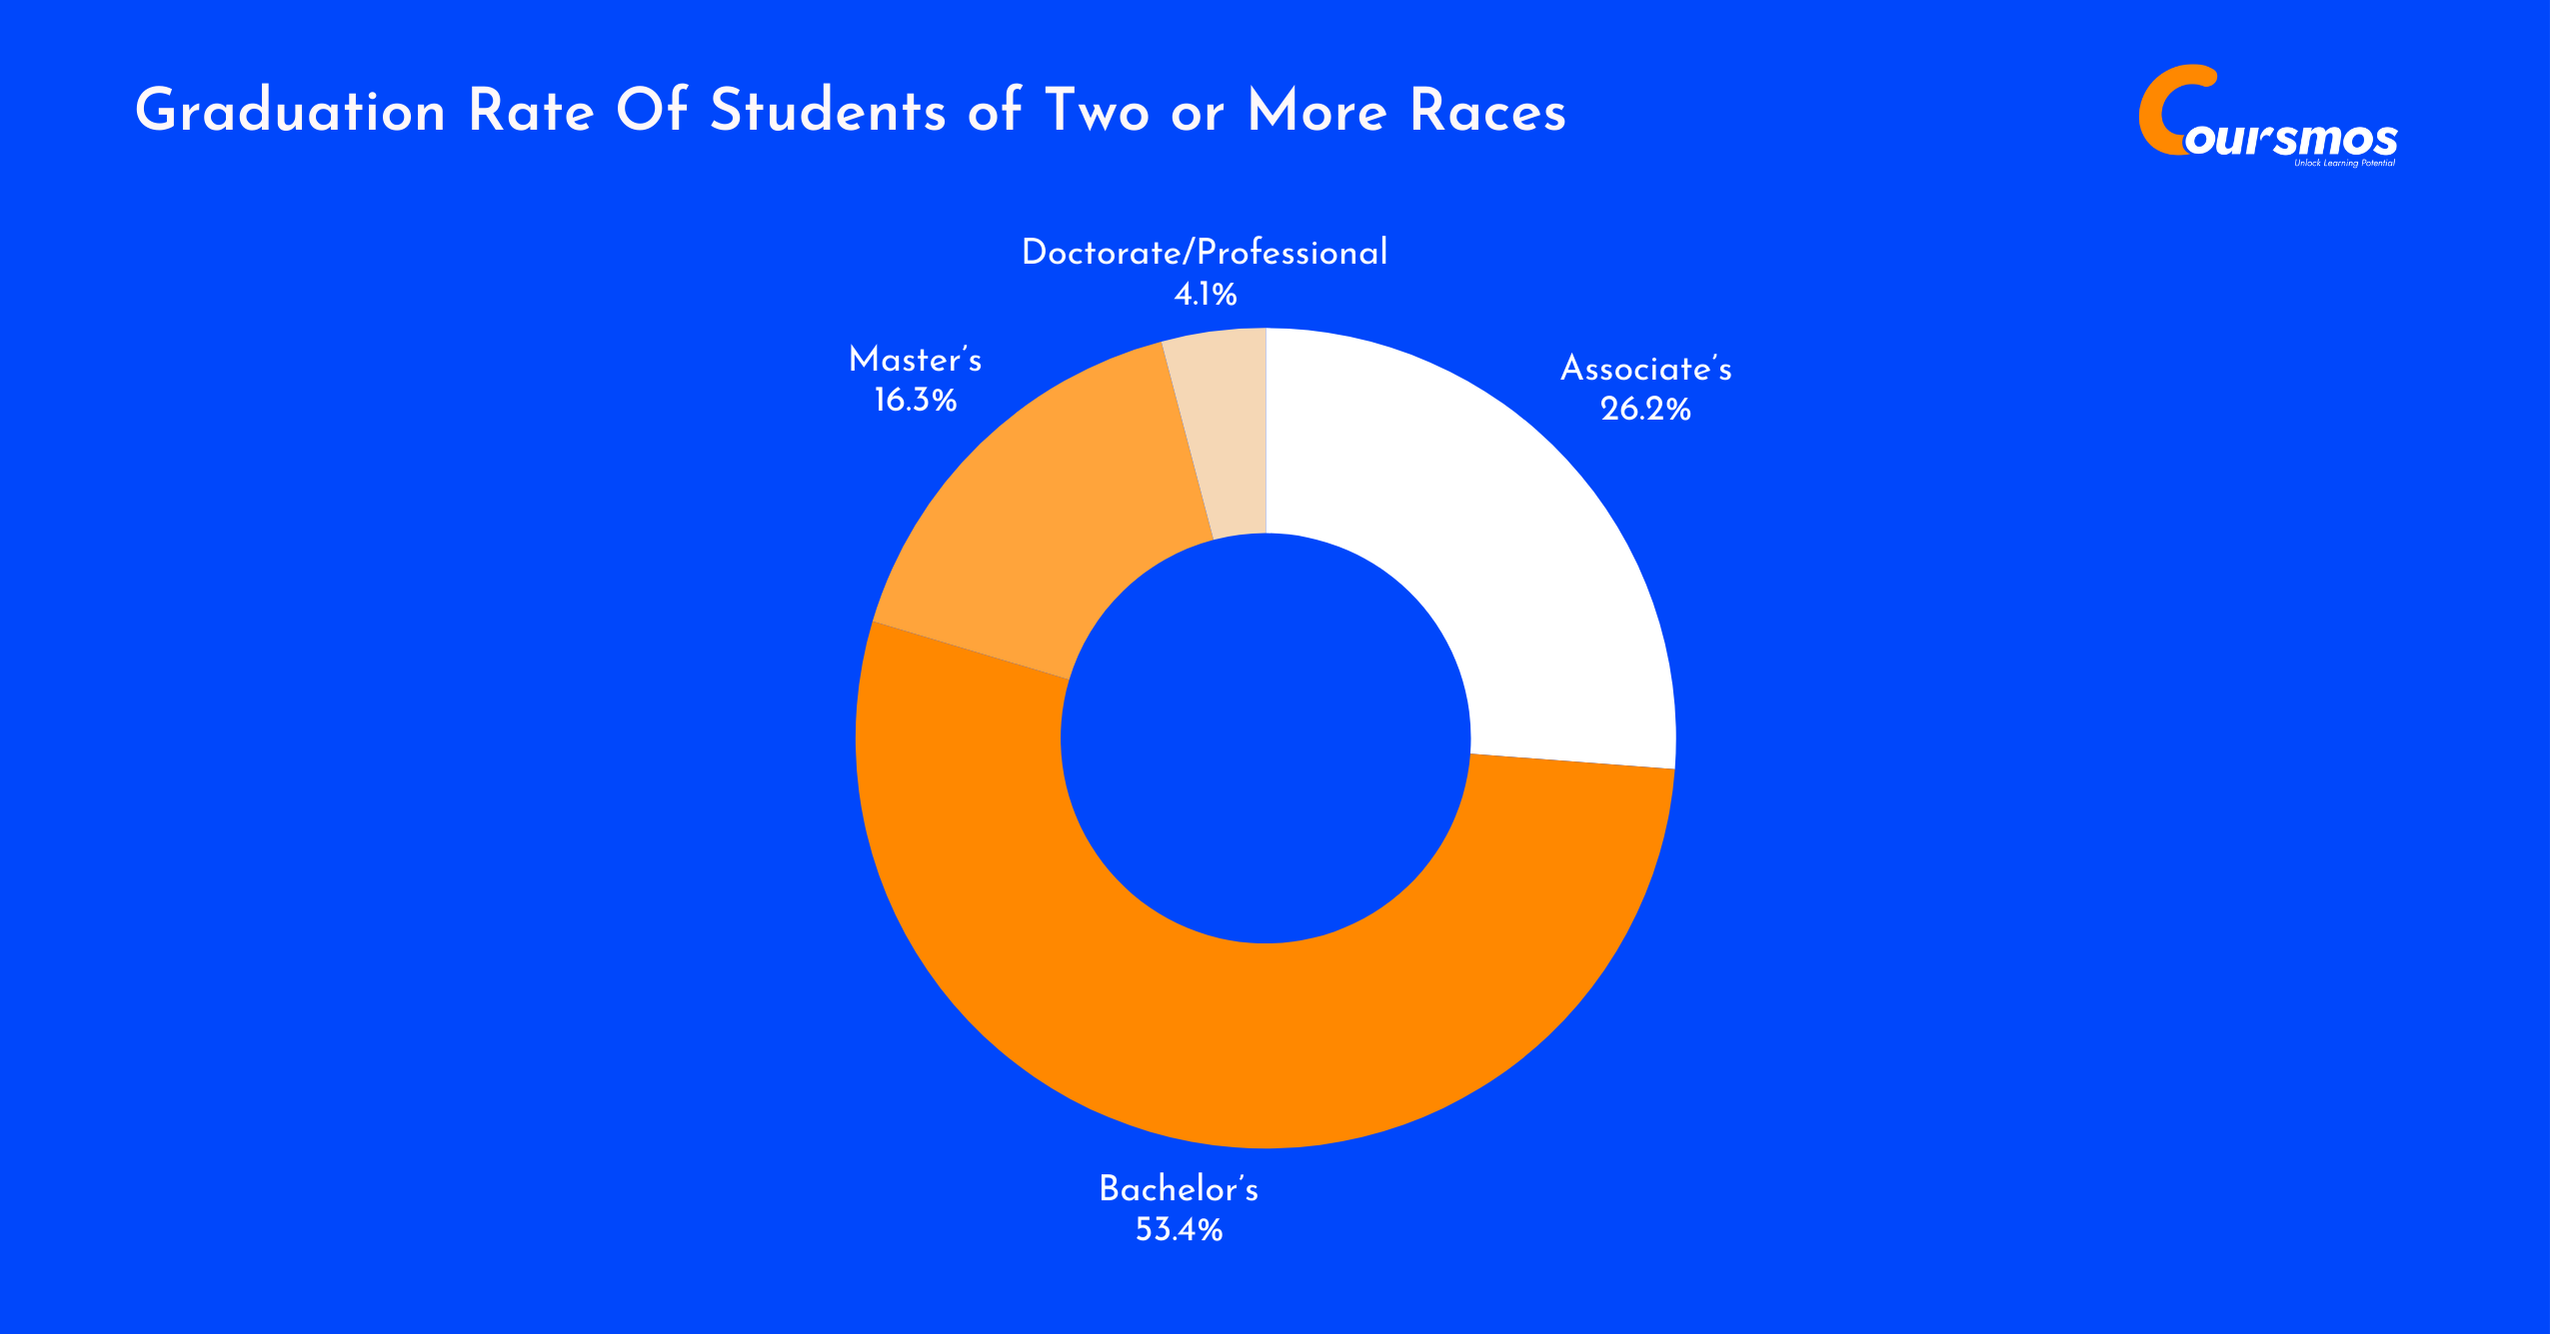
| Degree Level | Graduates | Share Within Group | Share of All Graduates |
|---|---|---|---|
| Associate’s | 40,040 | 26.2% | 4.0% |
| Bachelor’s | 81,660 | 53.4% | 4.1% |
| Master’s | 24,970 | 16.3% | 2.8% |
| Doctorate/Professional | 6,220 | 4.1% | 3.1% |
| Total Graduates | 152,890 | 100% | 3.7% |
Nonresident Students’ Graduation Rate
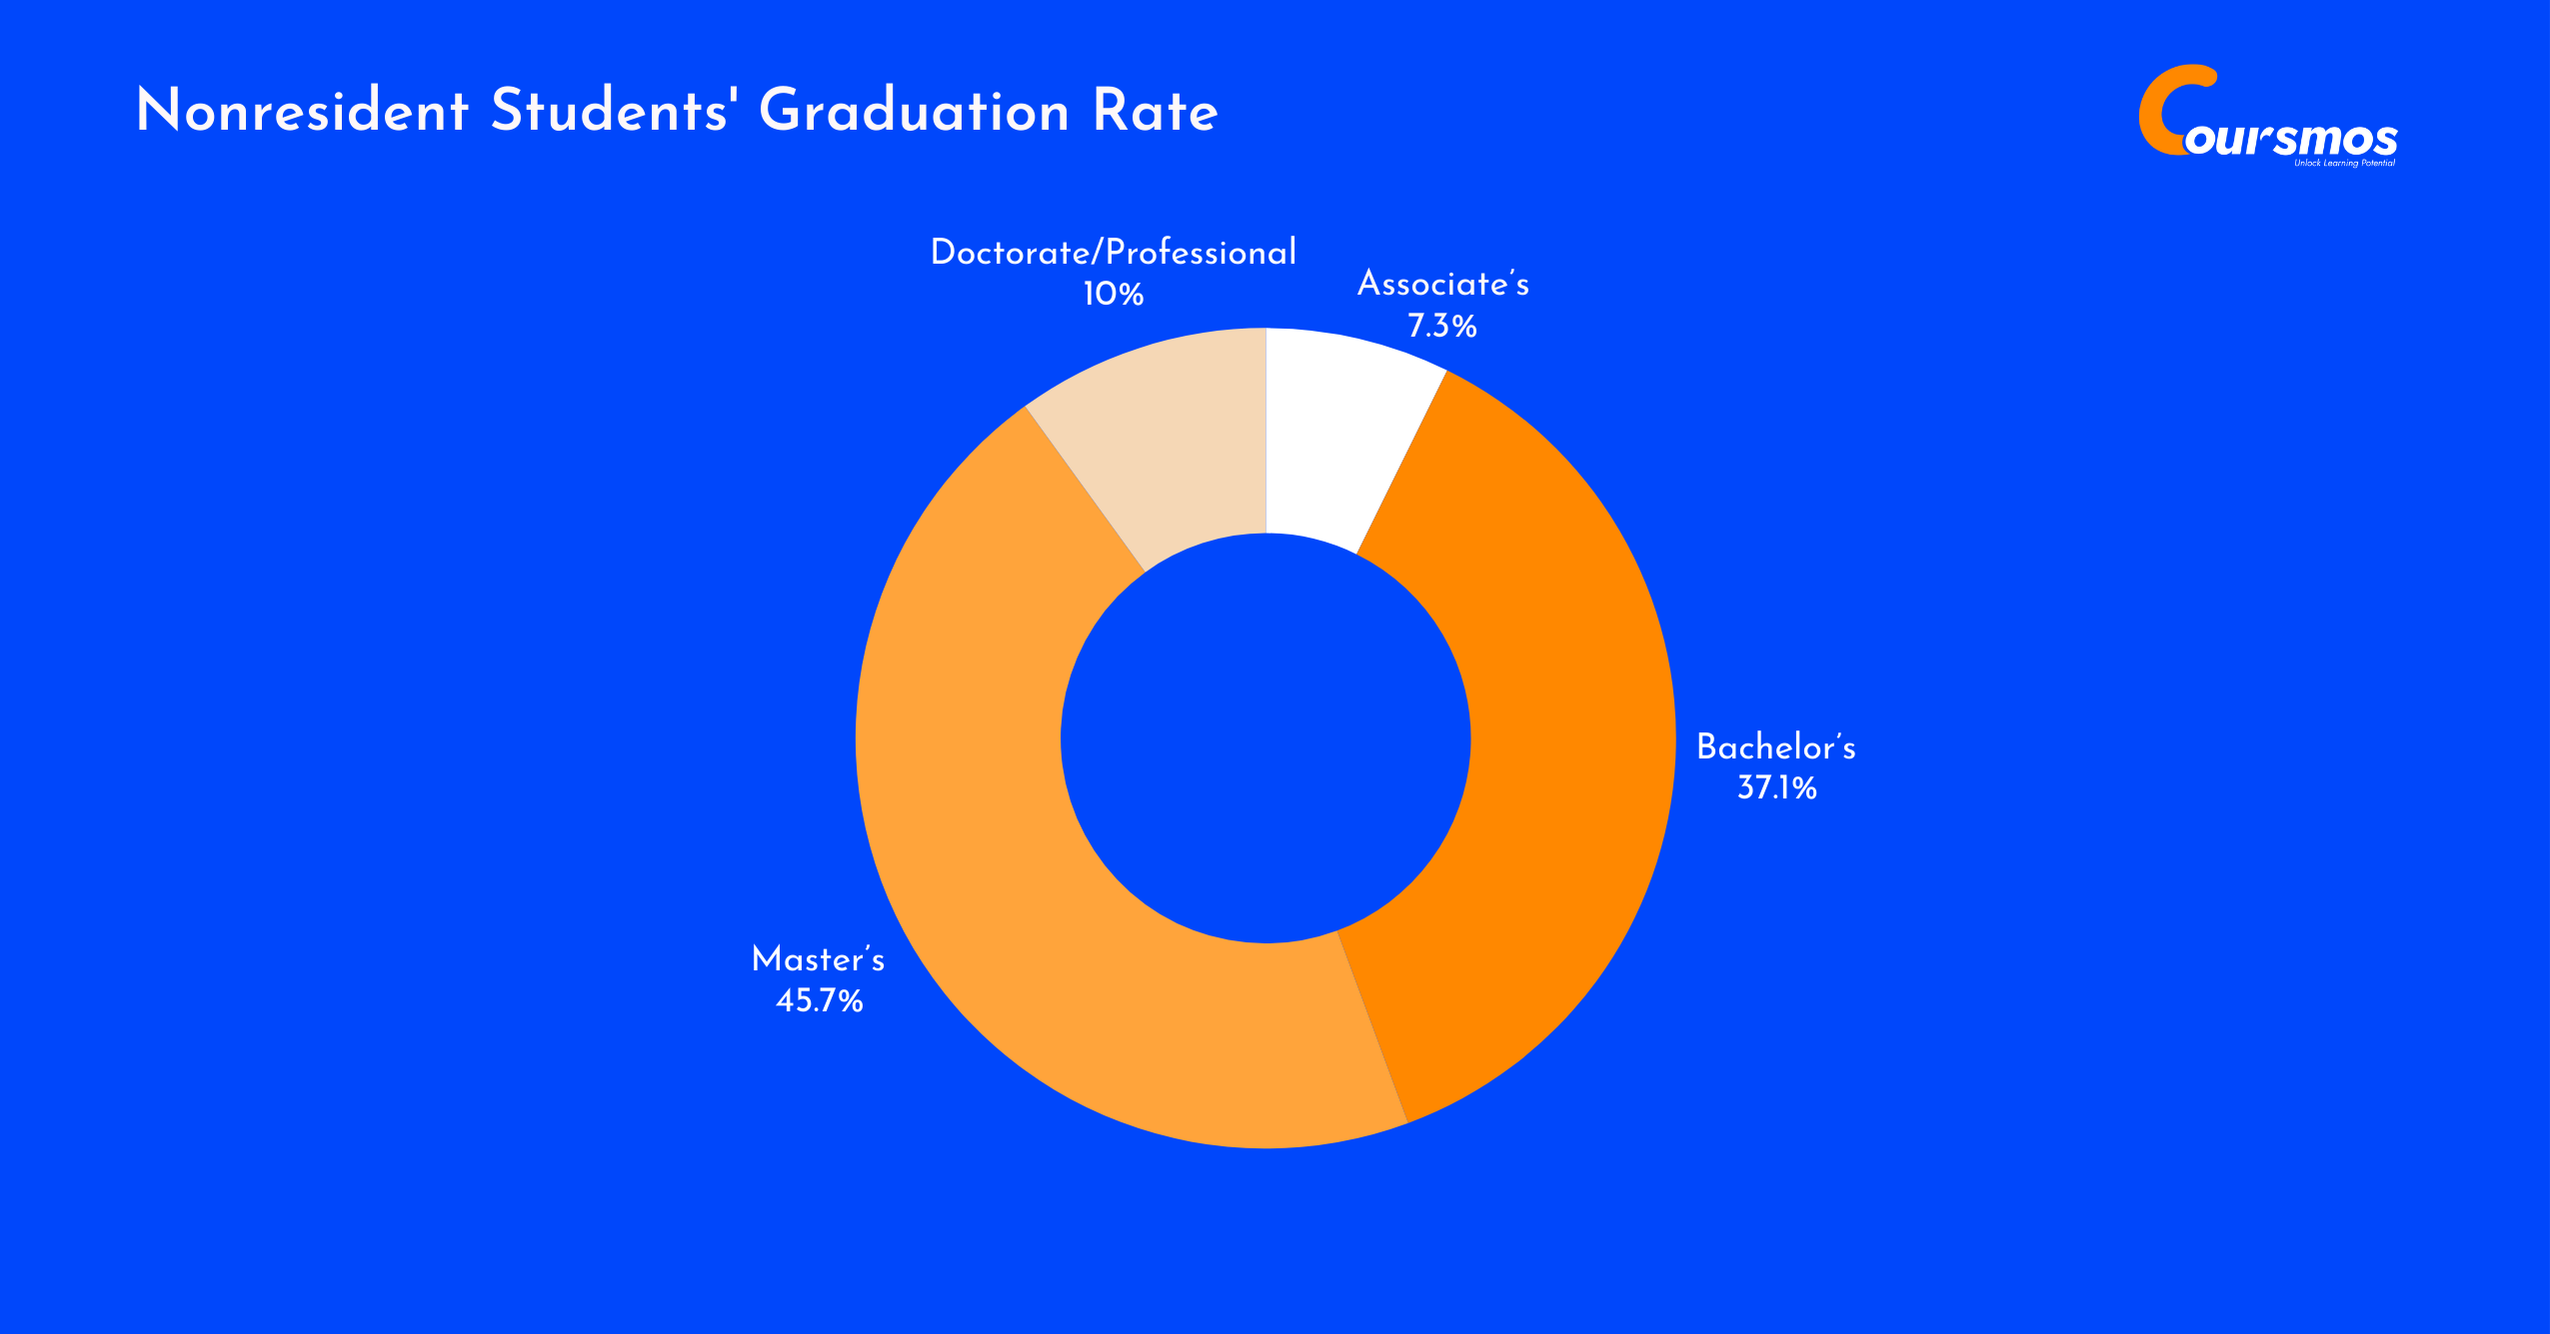
Nonresident (international) students made up 6.2% of total graduates, with the largest share (45.7%) earning master’s degrees.
While only 7.3% completed associate’s degrees, their representation was strong in advanced studies, contributing to 13.2% of all master’s and 12.4% of doctorate/professional degrees. This group shows a clear focus on graduate-level education in the U.S.
| Degree Level | Graduates | Share Within Group | Share of All Graduates |
|---|---|---|---|
| Associate’s | 18,520 | 7.3% | 1.8% |
| Bachelor’s | 94,400 | 37.1% | 4.7% |
| Master’s | 116,220 | 45.7% | 13.2% |
| Doctorate/Professional | 25,340 | 10.0% | 12.4% |
| Total Graduates | 254,490 | 100% | 6.2% |
Source: Education Data
College Graduation Rates By School Type
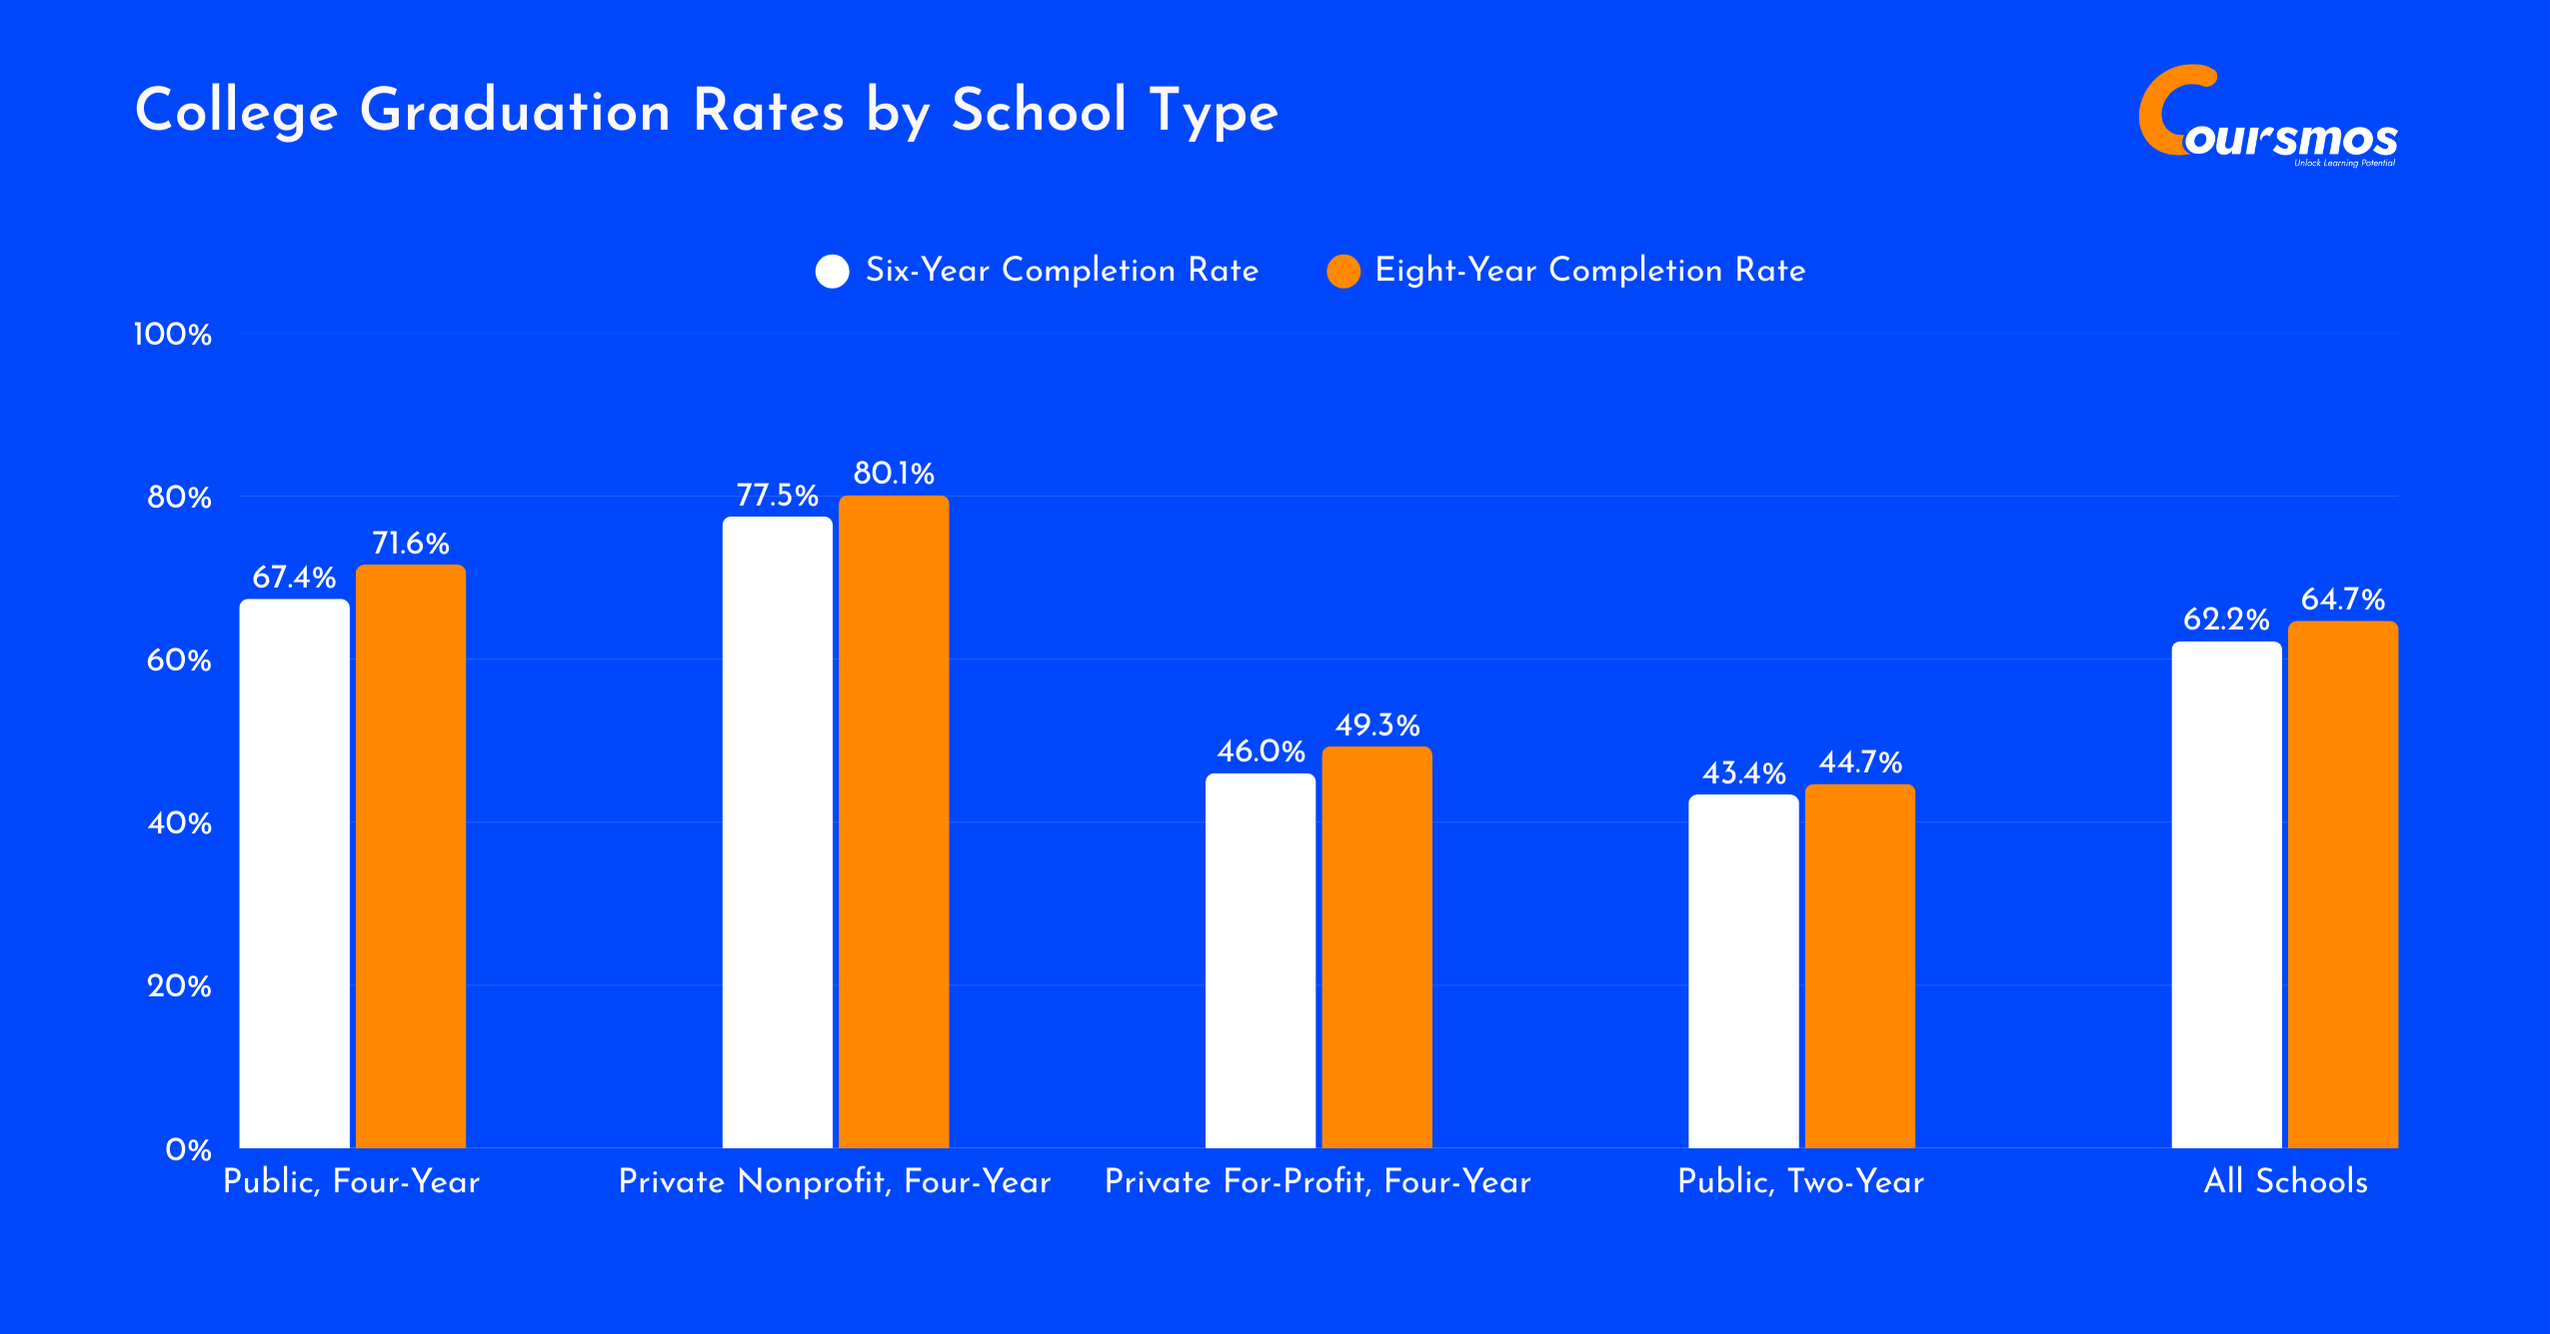
In 2023, graduation rates varied widely depending on the type of institution.
Private nonprofit four-year colleges had the highest graduation rates, with 77.5% of students finishing within six years and 80.1% completing their degree within eight years.
Public four-year universities had a solid completion rate of 67.4% over six years, which increased to 71.6% after eight years, indicating that many students take longer than six years to finish their degrees.
On the other hand, private for-profit four-year schools had the lowest graduation rates, with just 46% of students graduating in six years, and only 49.3% finishing in eight years. This suggests that students in for-profit institutions may face significant challenges, such as financial difficulties or limited academic support, which hinder their ability to graduate on time.
Here is a table displaying the College Graduation Rates by School Type:
| Institution Type | Six-Year Completion Rate | Eight-Year Completion Rate |
|---|---|---|
| Public, Four-Year | 67.4% | 71.6% |
| Private Nonprofit, Four-Year | 77.5% | 80.1% |
| Private For-Profit, Four-Year | 46% | 49.3% |
| Public, Two-Year | 43.4% | 44.7% |
| All Schools | 62.2% | 64.7% |
Source: NSCRC
Of all students who started at public two-year colleges, only 43.4% graduated within six years, meaning most students either dropped out or are still working toward their degree.
7.7% transferred to a four-year college and graduated, showing that some use community college as a starting point for bigger academic goals.
11.2% are still enrolled after six years, possibly studying part-time or facing personal or financial challenges.
But the biggest concern is that 45.4% left college without finishing. Nearly half never earned a degree or credential, which can hurt their chances at better jobs or career growth.
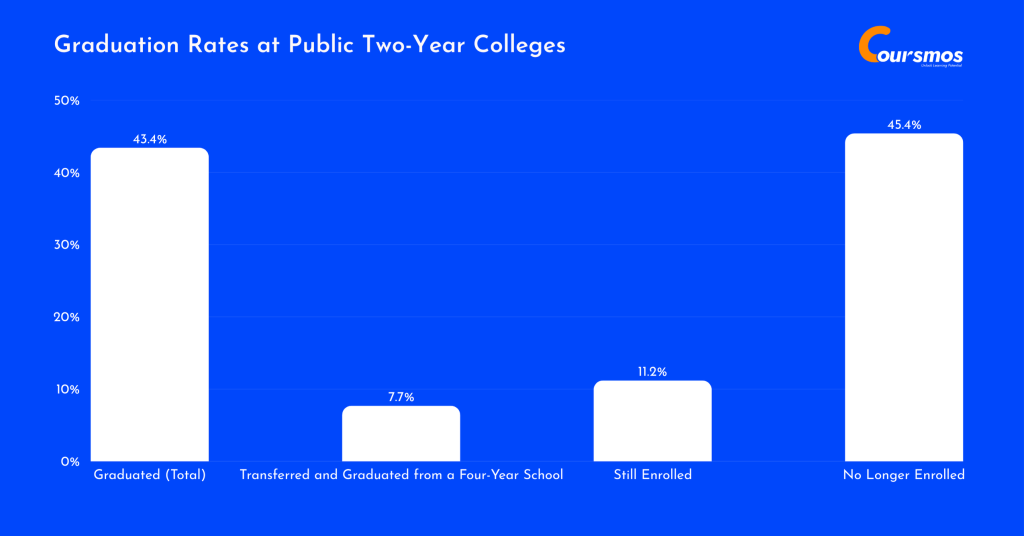
Here are further details about the Six-Year Graduation Rates at Public Two-Year Colleges in 2023:
- Graduated (Total): 43.4%
- Transferred and Graduated from a Four-Year School: 7.7%
- Still Enrolled: 11.2%
- No Longer Enrolled: 45.4%
Source: NSCRC
College Graduates By Major
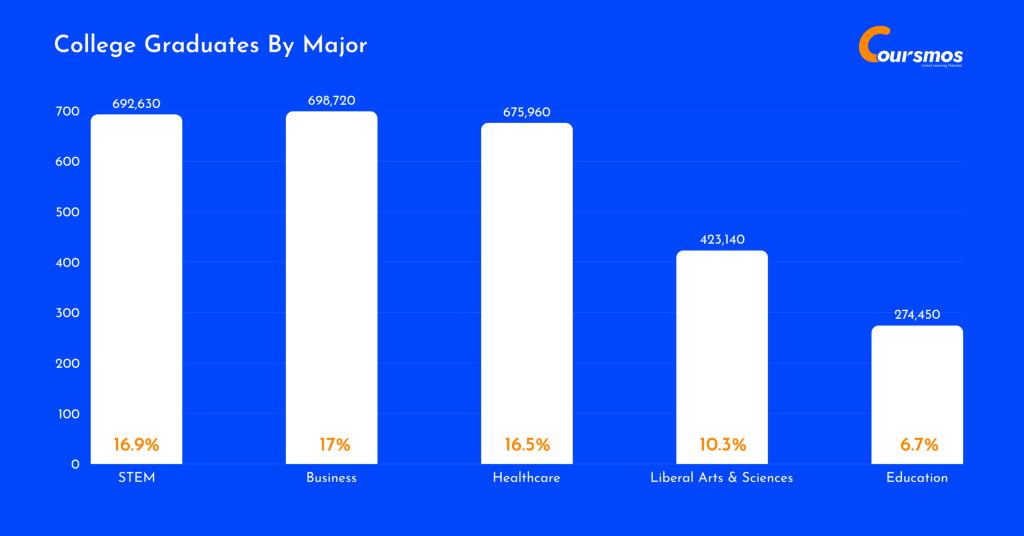
Business and healthcare dominate college majors across most degree levels, but their popularity shifts as students advance.
At the associate’s level, liberal arts and sciences take the lead with 38% of students, while health professions (17.6%) and business (11.2%) follow.
For bachelor’s degrees, business is the most common choice (18.6%), with healthcare close behind (13.1%). At the master’s level, business remains dominant (23.4%), but education (17.2%) and healthcare (16.7%) also see significant interest. By the doctorate level, healthcare becomes the top field by far, accounting for 43% of all doctorate or professional degrees.
Here is a table displaying the share of college graduates by major:
| Field | Total Graduates | Associate’s (%) | Bachelor’s (%) | Master’s (%) | Doctorate/Professional (%) |
|---|---|---|---|---|---|
| STEM | 692,630 (16.9%) | 84,860 (12.3%) | 435,510 (62.9%) | 139,940 (20.2%) | 32,320 (4.7%) |
| Business | 698,720 (17.0%) | 113,070 (16.2%) | 375,420 (53.7%) | 205,750 (29.5%) | 4,490 (0.64%) |
| Healthcare | 675,960 (16.5%) | 177,410 (26.2%) | 263,770 (39.0%) | 147,040 (21.8%) | 87,750 (13.0%) |
| Liberal Arts & Sciences | 423,140 (10.3%) | 383,290 (90.6%) | 37,890 (9.0%) | 1,860 (0.44%) | 110 (0.03%) |
| Education | 274,450 (6.7%) | 18,500 (6.7%) | 89,410 (32.6%) | 151,710 (55.3%) | 14,840 (5.4%) |
Source: Education Data
Graduation Statistics By State
Rhode Island leads the nation with the highest average college graduation rate of 69% for the 2020-2021 period, followed closely by Utah at 66% and Massachusetts at 65%.
States like Florida and the District of Columbia rank lower, both at 62%, highlighting the significant regional differences in graduation rates across the U.S.
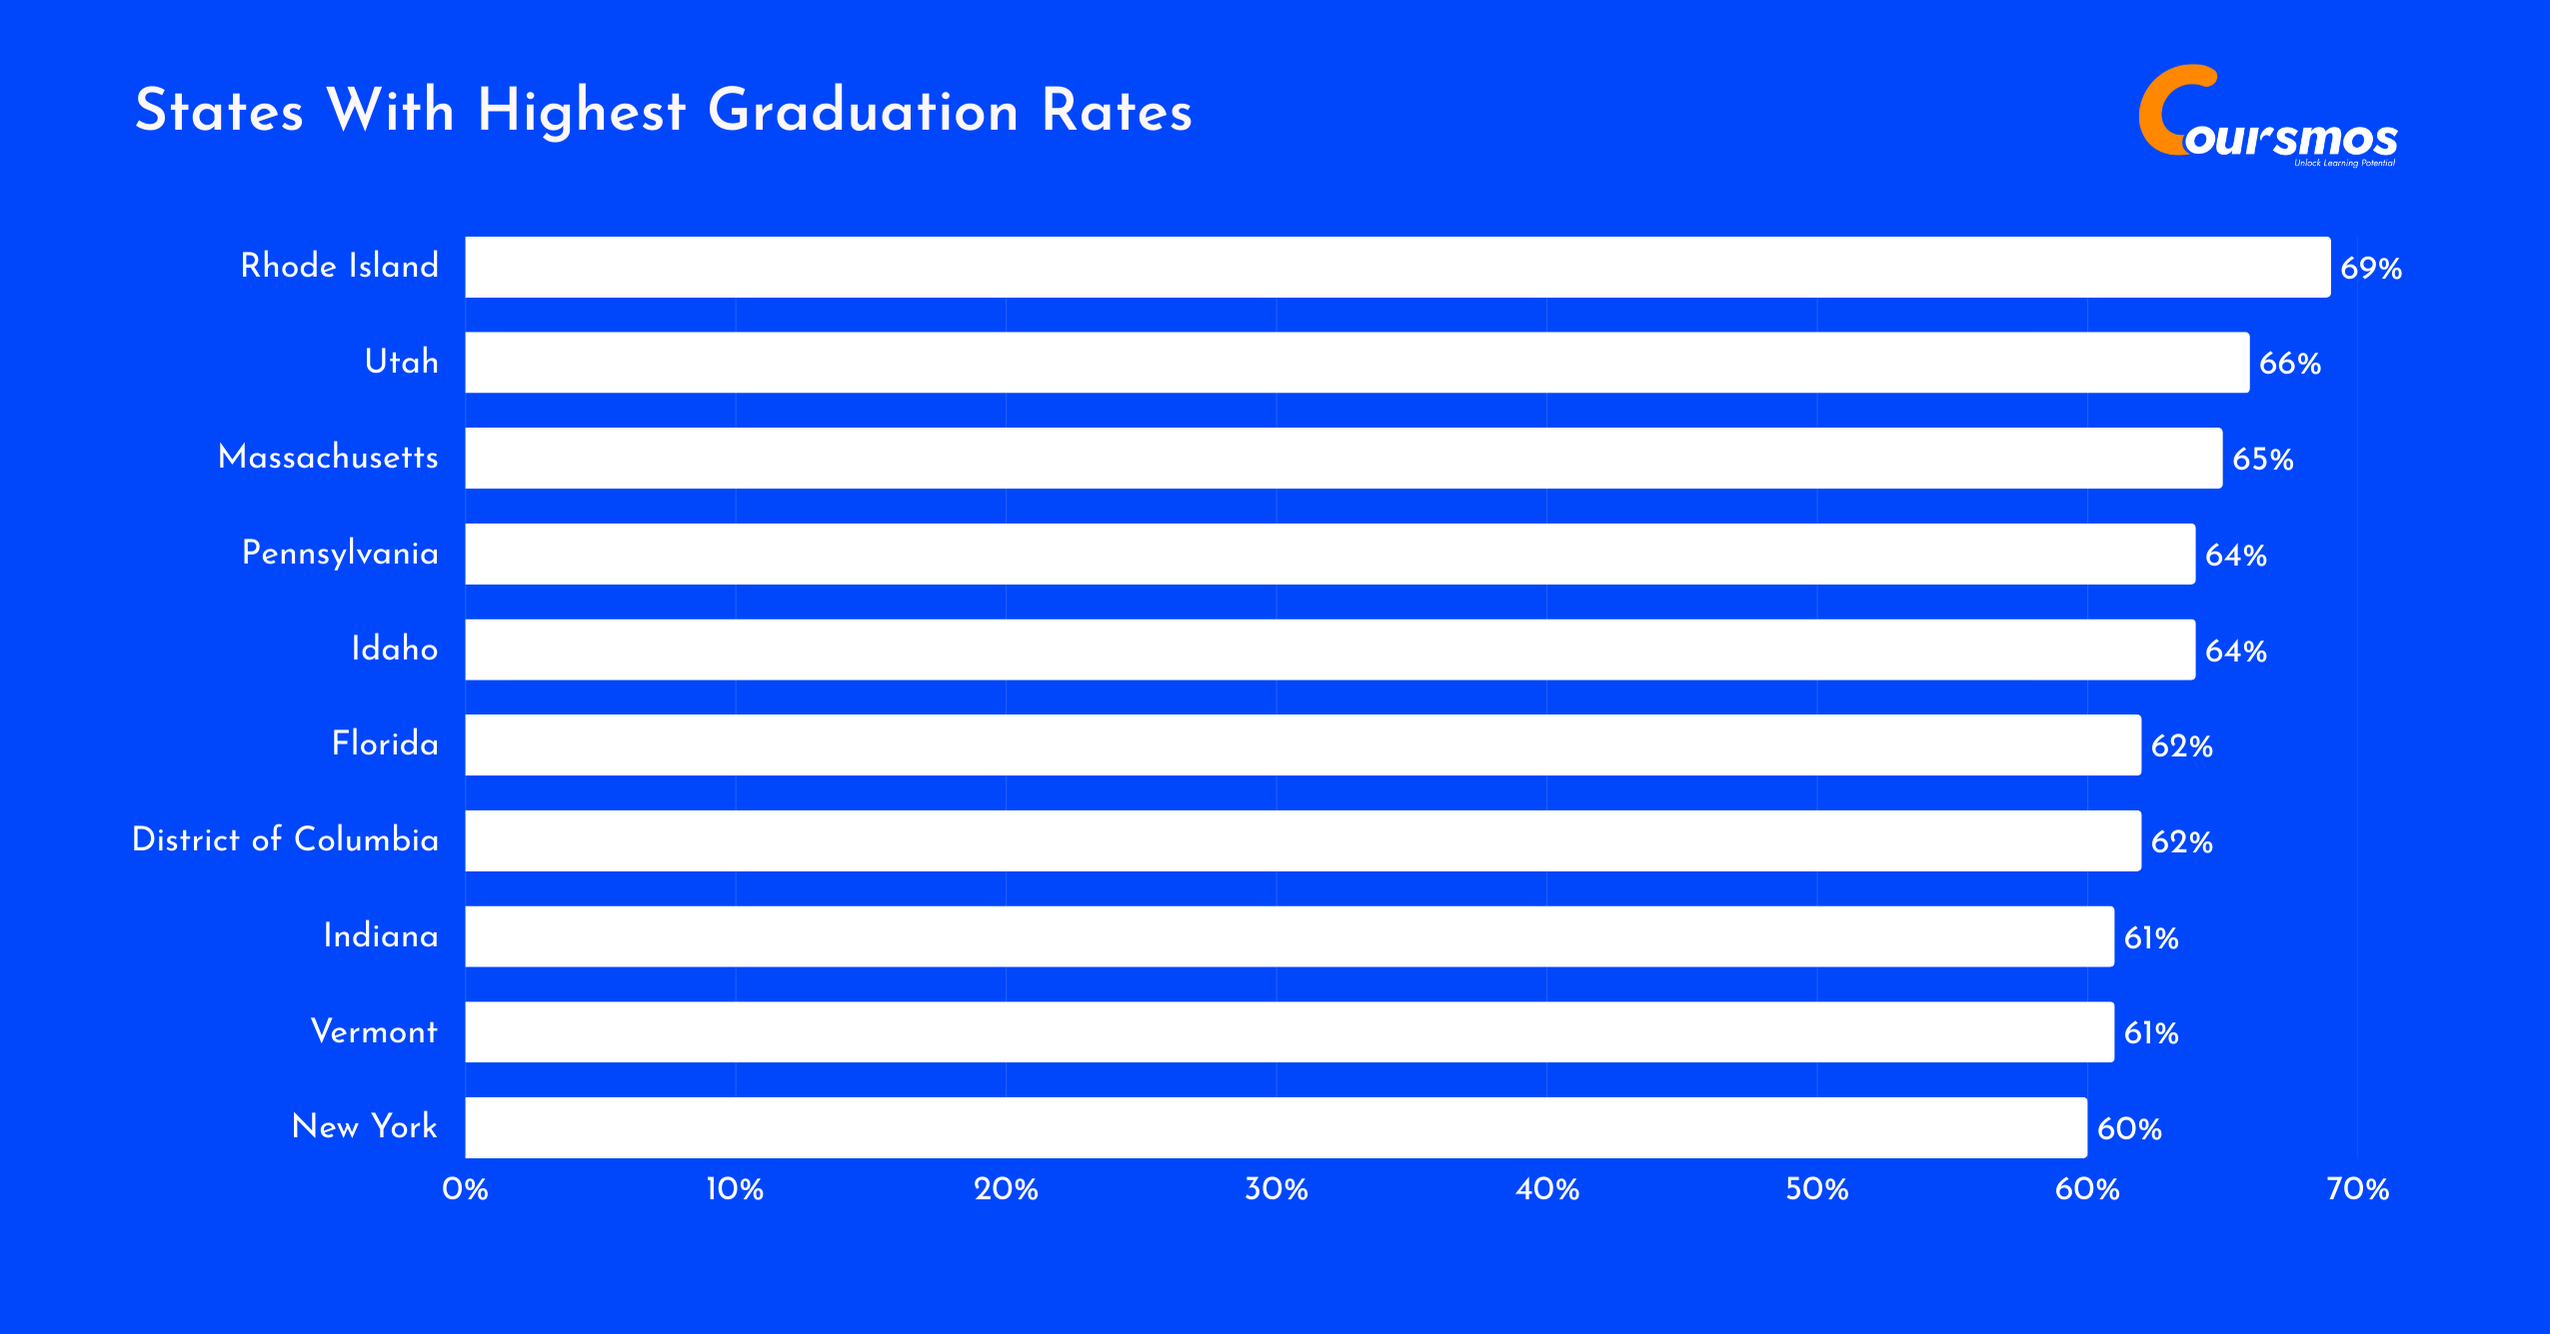
Here is a table displaying the states with the highest graduation rates:
| Ranking | State/District | Average College Graduation Rate, 2020-2021 |
|---|---|---|
| 1 | Rhode Island | 69% |
| 2 | Utah | 66% |
| 3 | Massachusetts | 65% |
| 4 | Pennsylvania | 64% |
| 5 | Idaho | 64% |
| 6 | Florida | 62% |
| 7 | District of Columbia | 62% |
| 8 | Indiana | 61% |
| 9 | Vermont | 61% |
| 10 | New York | 60% |
Source: US Department of Education
38% of students in New Mexico graduated from college in the 2020–2021 academic year, the lowest rate across the states.
44% of students in both Alabama and Alaska also completed their college education, highlighting a significant gap compared to higher-performing states.
46% of students graduated in Georgia and Hawaii, while North Dakota and Montana saw graduation rates of 47%. States like South Carolina, Arkansas, and Wyoming had slightly better rates at 48%.
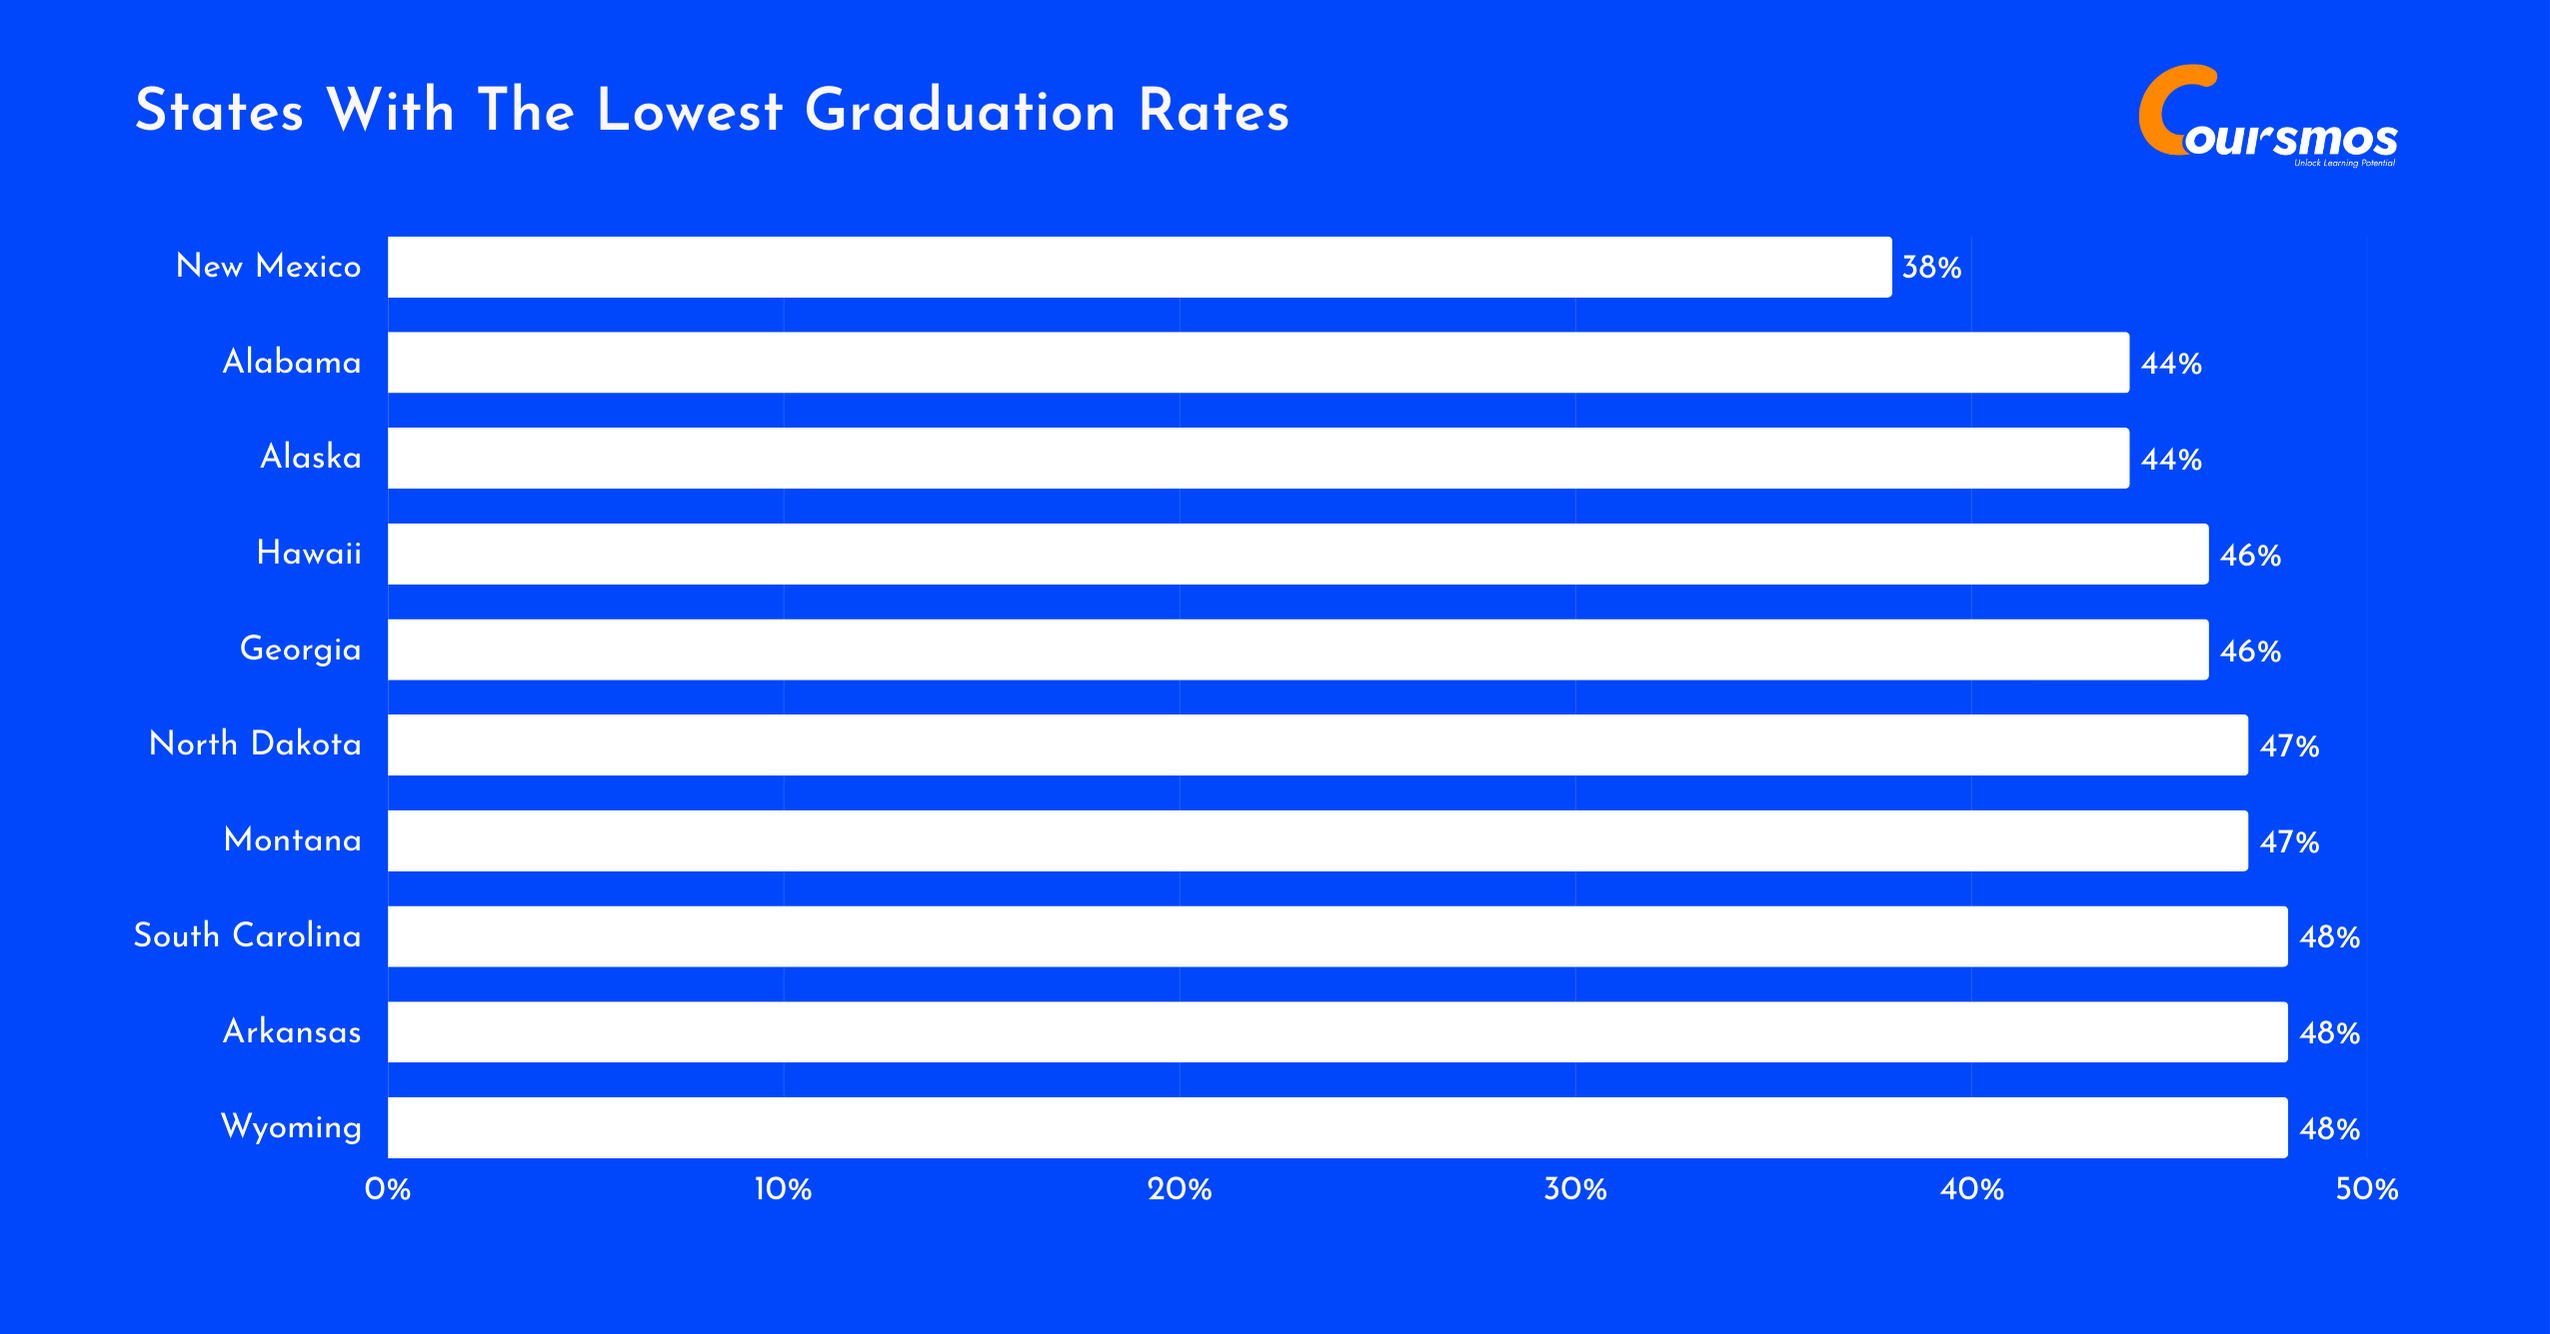
Here is a table displaying the states with the lowest graduation rates:
| State/District | Average College Graduation Rate, 2020-2021 |
|---|---|
| New Mexico | 38% |
| Alabama | 44% |
| Alaska | 44% |
| Hawaii | 46% |
| Georgia | 46% |
| North Dakota | 47% |
| Montana | 47% |
| South Carolina | 48% |
| Arkansas | 48% |
| Wyoming | 48% |
Source: US Department of Education
More Stat Like This: