College Dropout Statistics 2025 notes that nearly one in four undergraduate students (24%) are at risk of dropping out due to financial issues, while 41.9 million Americans already hold some college credits but no degree.
What drives these numbers, who is most at risk, and what do these statistics mean for students, institutions, and the future of higher education?
Let’s get into America’s college dropout crisis.
Top Picks: What Percentage Of College Students Drop Out?
- 24% of current undergraduate students are at risk of dropping out, having seriously considered leaving school or being at risk of dismissal in 2024.
- 41% of first-generation students have seriously considered leaving college, making them twice as likely to drop out compared to students with college-educated parents (18%) in 2024.
- 2.1 million Americans between the ages of 16 and 24 were high school dropouts in 2022. 5.3% was the overall status dropout rate in 2022, significantly decreasing from 7.0% in 2012.
- 11.6% of foreign-born students dropped out compared to 4.8% of U.S.-born students in 2022.
- 20.2% of foreign-born Hispanic students had a significantly higher dropout rate than their U.S.-born peers at 5.6% in 2022.
- 9.7% of students with disabilities dropped out compared to 4.9% of students without disabilities in 2022. (NCES)
- 33.4 million Americans aged 25 and older had some college education but no degree in 2021. (Census Gov)
- As per the latest data, the unemployment rate for non-enrolled Black youth was 14%, more than double the 6.7% rate for Asian youth. (BLS)
- 17.3 million married individuals had some college credits but did not complete a degree, while 7.8 million never-married individuals attended college without a degree. (Census)
- 30 million native-born Americans had some college but no degree in 2021.
- 3.3 million foreign-born individuals had some college credits but no completed degree in 2021. (Census)
College Students Dropout Rates Year Wise
- 41.9 million Americans had some college credits but no credentials as of July 2022. There has been a 2.9% increase in working-age dropouts from 2021 to 2022
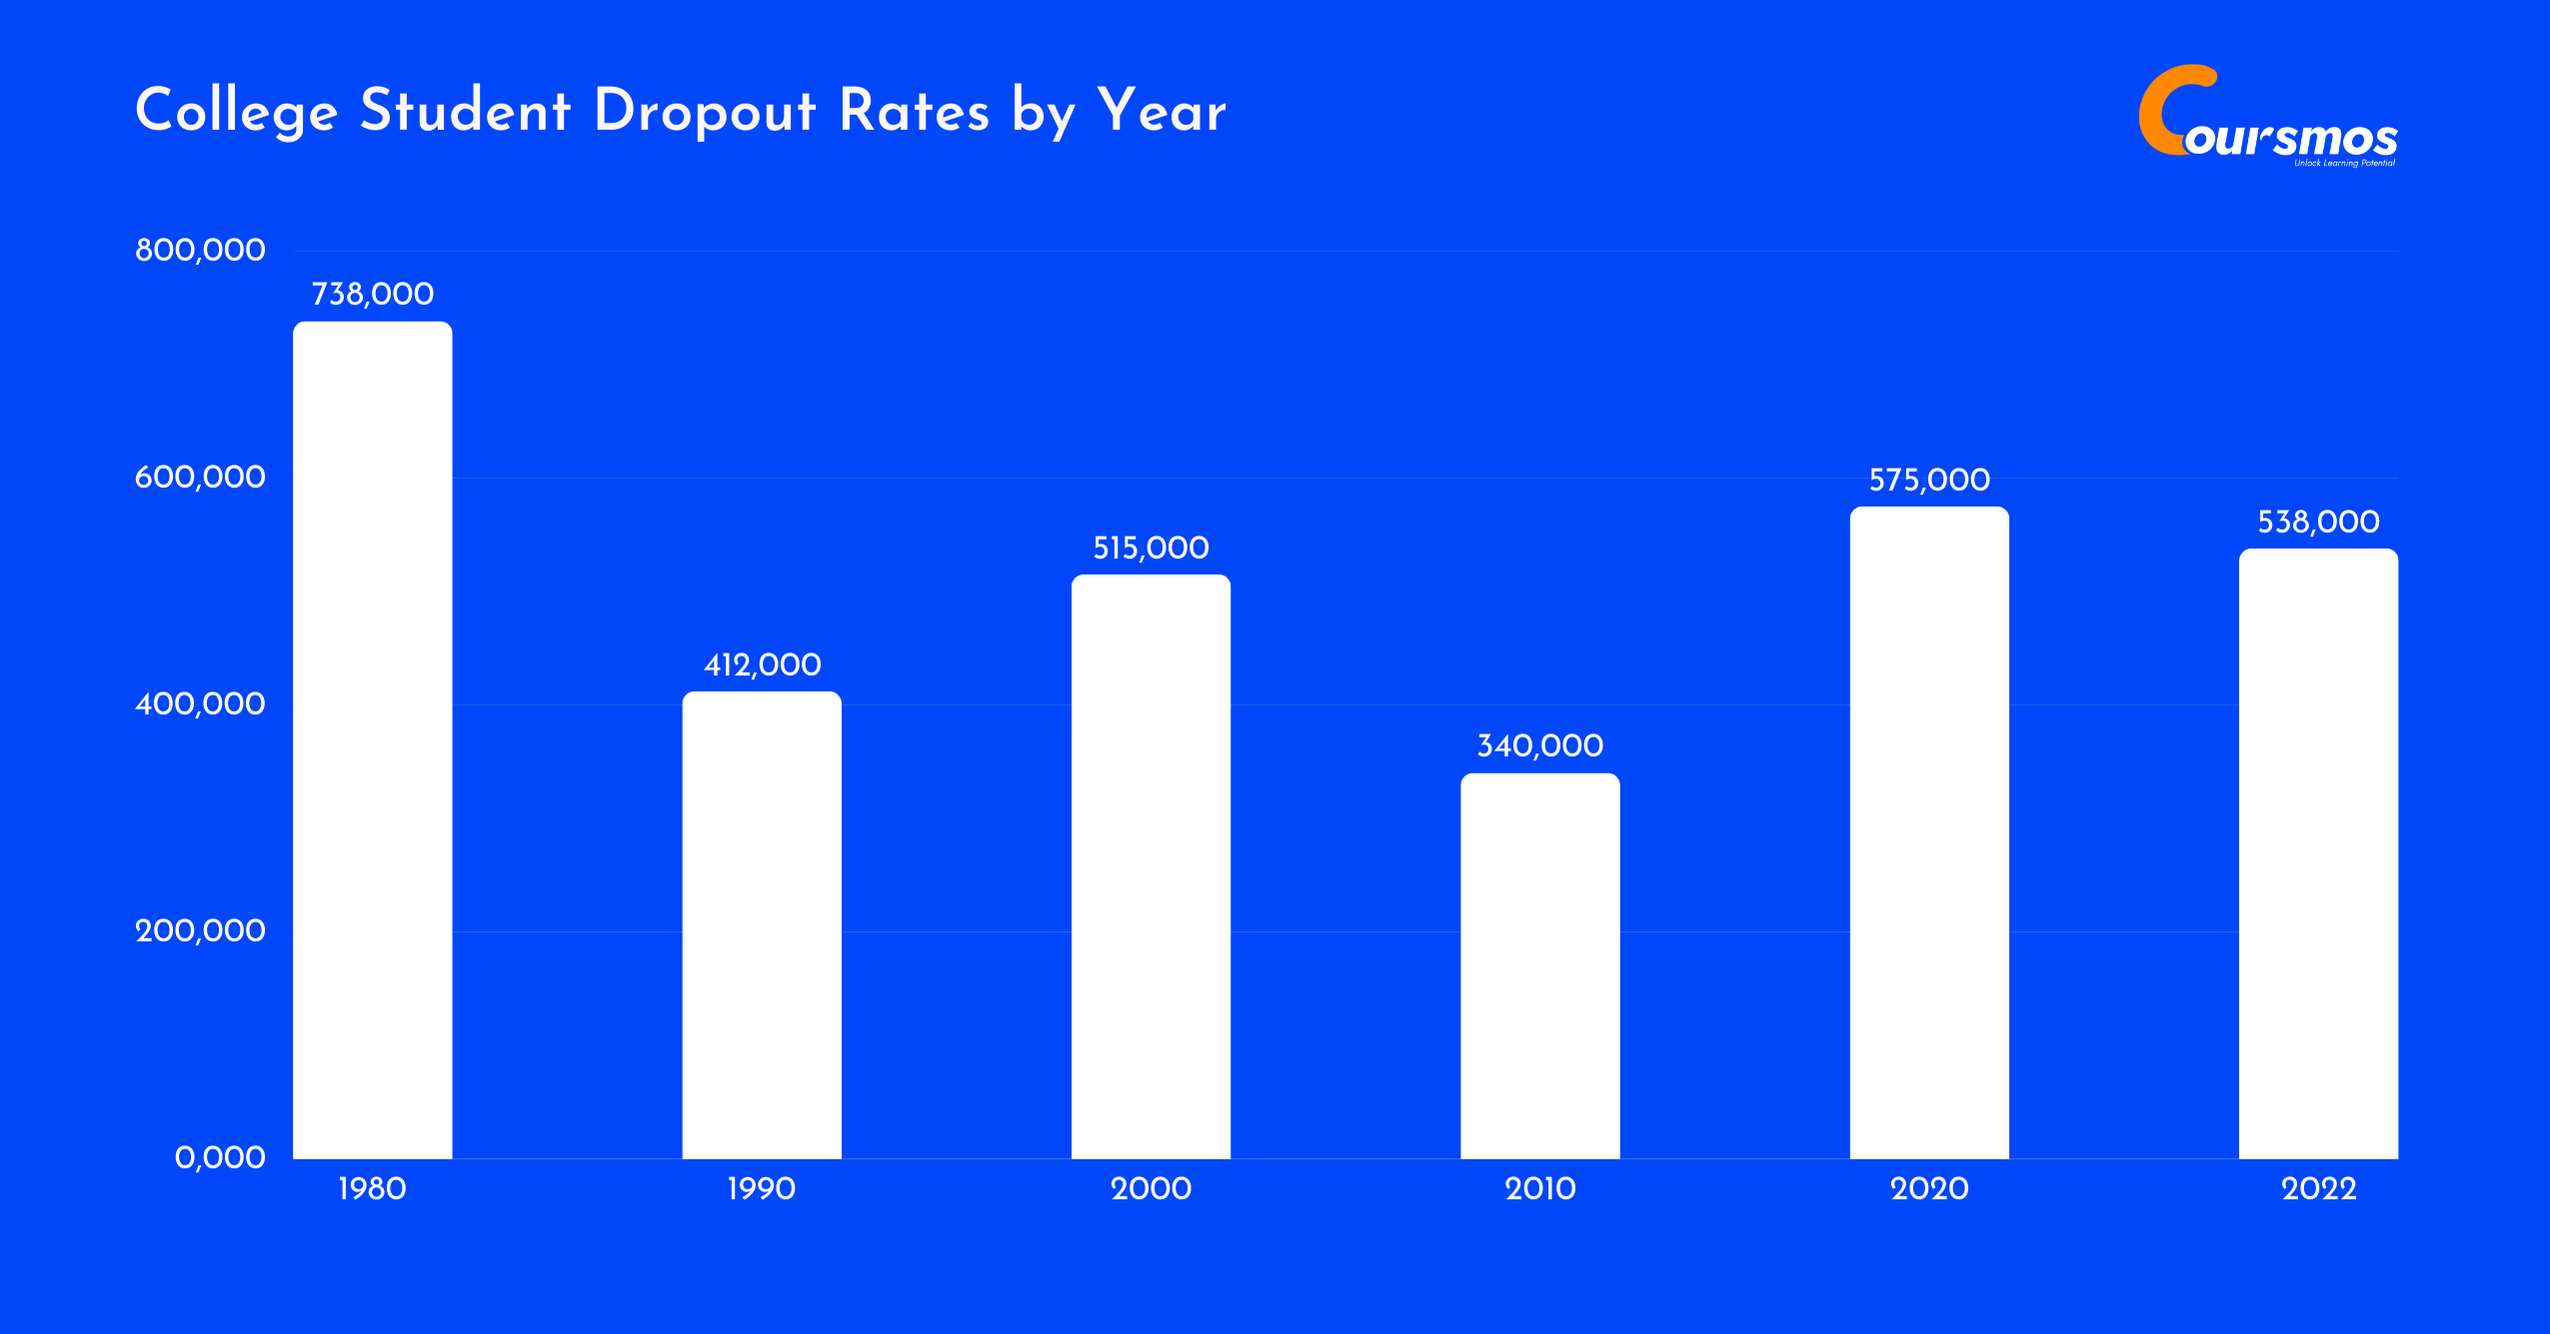
- The total number of dropouts decreased substantially, from 738,000 in 1980 to 538,000 in 2022, reflecting progress in reducing high school attrition.

| Year | Total Dropouts | Labor Force Participation | Unemployment Rate | Not in the Labor Force |
|---|---|---|---|---|
| 1980 | 738,000 | 63.80% | 31.40% | 36.20% |
| 1990 | 412,000 | 67.80% | 31.80% | 32.20% |
| 2000 | 515,000 | 68.00% | 28.10% | 32.00% |
| 2010 | 340,000 | 53.90% | 42.70% | 46.10% |
| 2020 | 575,000 | 47.50% | 7.50% | 52.50% |
| 2022 | 538,000 | 41.90% | 18.50% | 58.10% |
What College Major Has The Highest Dropout Rate?
- Computer Science leads with a 10.7% dropout rate, significantly higher than other major fields in 2023.
Here are the top five majors with the highest dropout rates:
- 10.7% of Computer Science students drop out of their program
- 7.7% of Advertising students leave before completion
- 7.4% of Agriculture students don’t complete their degrees
- 7.3% of Art students drop out before graduating
- 7.2% of Architecture students leave their programs
- Public colleges retain 74.8% of first-time undergraduates.
- Private nonprofit colleges keep 80.2% of their students.
- Private for-profit institutions maintain only 65.8% of students.
- Community colleges have the lowest retention at 61%.
Which Student Is Most At Risk For Dropping Out Of College?
- 83.8% of recent dropouts are between ages 18 and 34 in 2022, which shows that this age group is most likely to drop out. (NSC Research Center)
- 30% of students who seriously considered leaving college cited financial challenges as their primary reason in 2024.
- 53% of at-risk students reported difficulty meeting tuition costs compared to 21% of on-track students in 2024.
- 57% of at-risk students worked off-campus while in school compared to 38% of on-track students in 2024.
- 31% of at-risk students rated their mental health as excellent or good compared to 61% of on-track students in 2024.
- 18% of students cited mental health as a primary reason for considering leaving school in 2024.
Let us take a quick look at college dropout risk factors in 2024:
| Student Category | On Track | At Risk | Considered Leaving (Not Seriously) |
|---|---|---|---|
| Overall | 64% | 24% | 12% |
| White | 67% | 21% | 12% |
| Black | 60% | 31% | 9% |
| Hispanic | 56% | 31% | 13% |
| First-Generation | 45% | 41% | 14% |
| Not First-Generation | 70% | 18% | 12% |
| Low Income | 54% | 33% | 13% |
| Middle Income | 69% | 18% | 13% |
| High Income | 76% | 16% | 8% |
| Had a College Payment Plan | 76% | 15% | 9% |
| No Payment Plan | 51% | 34% | 15% |
College Dropout Rates By Gender

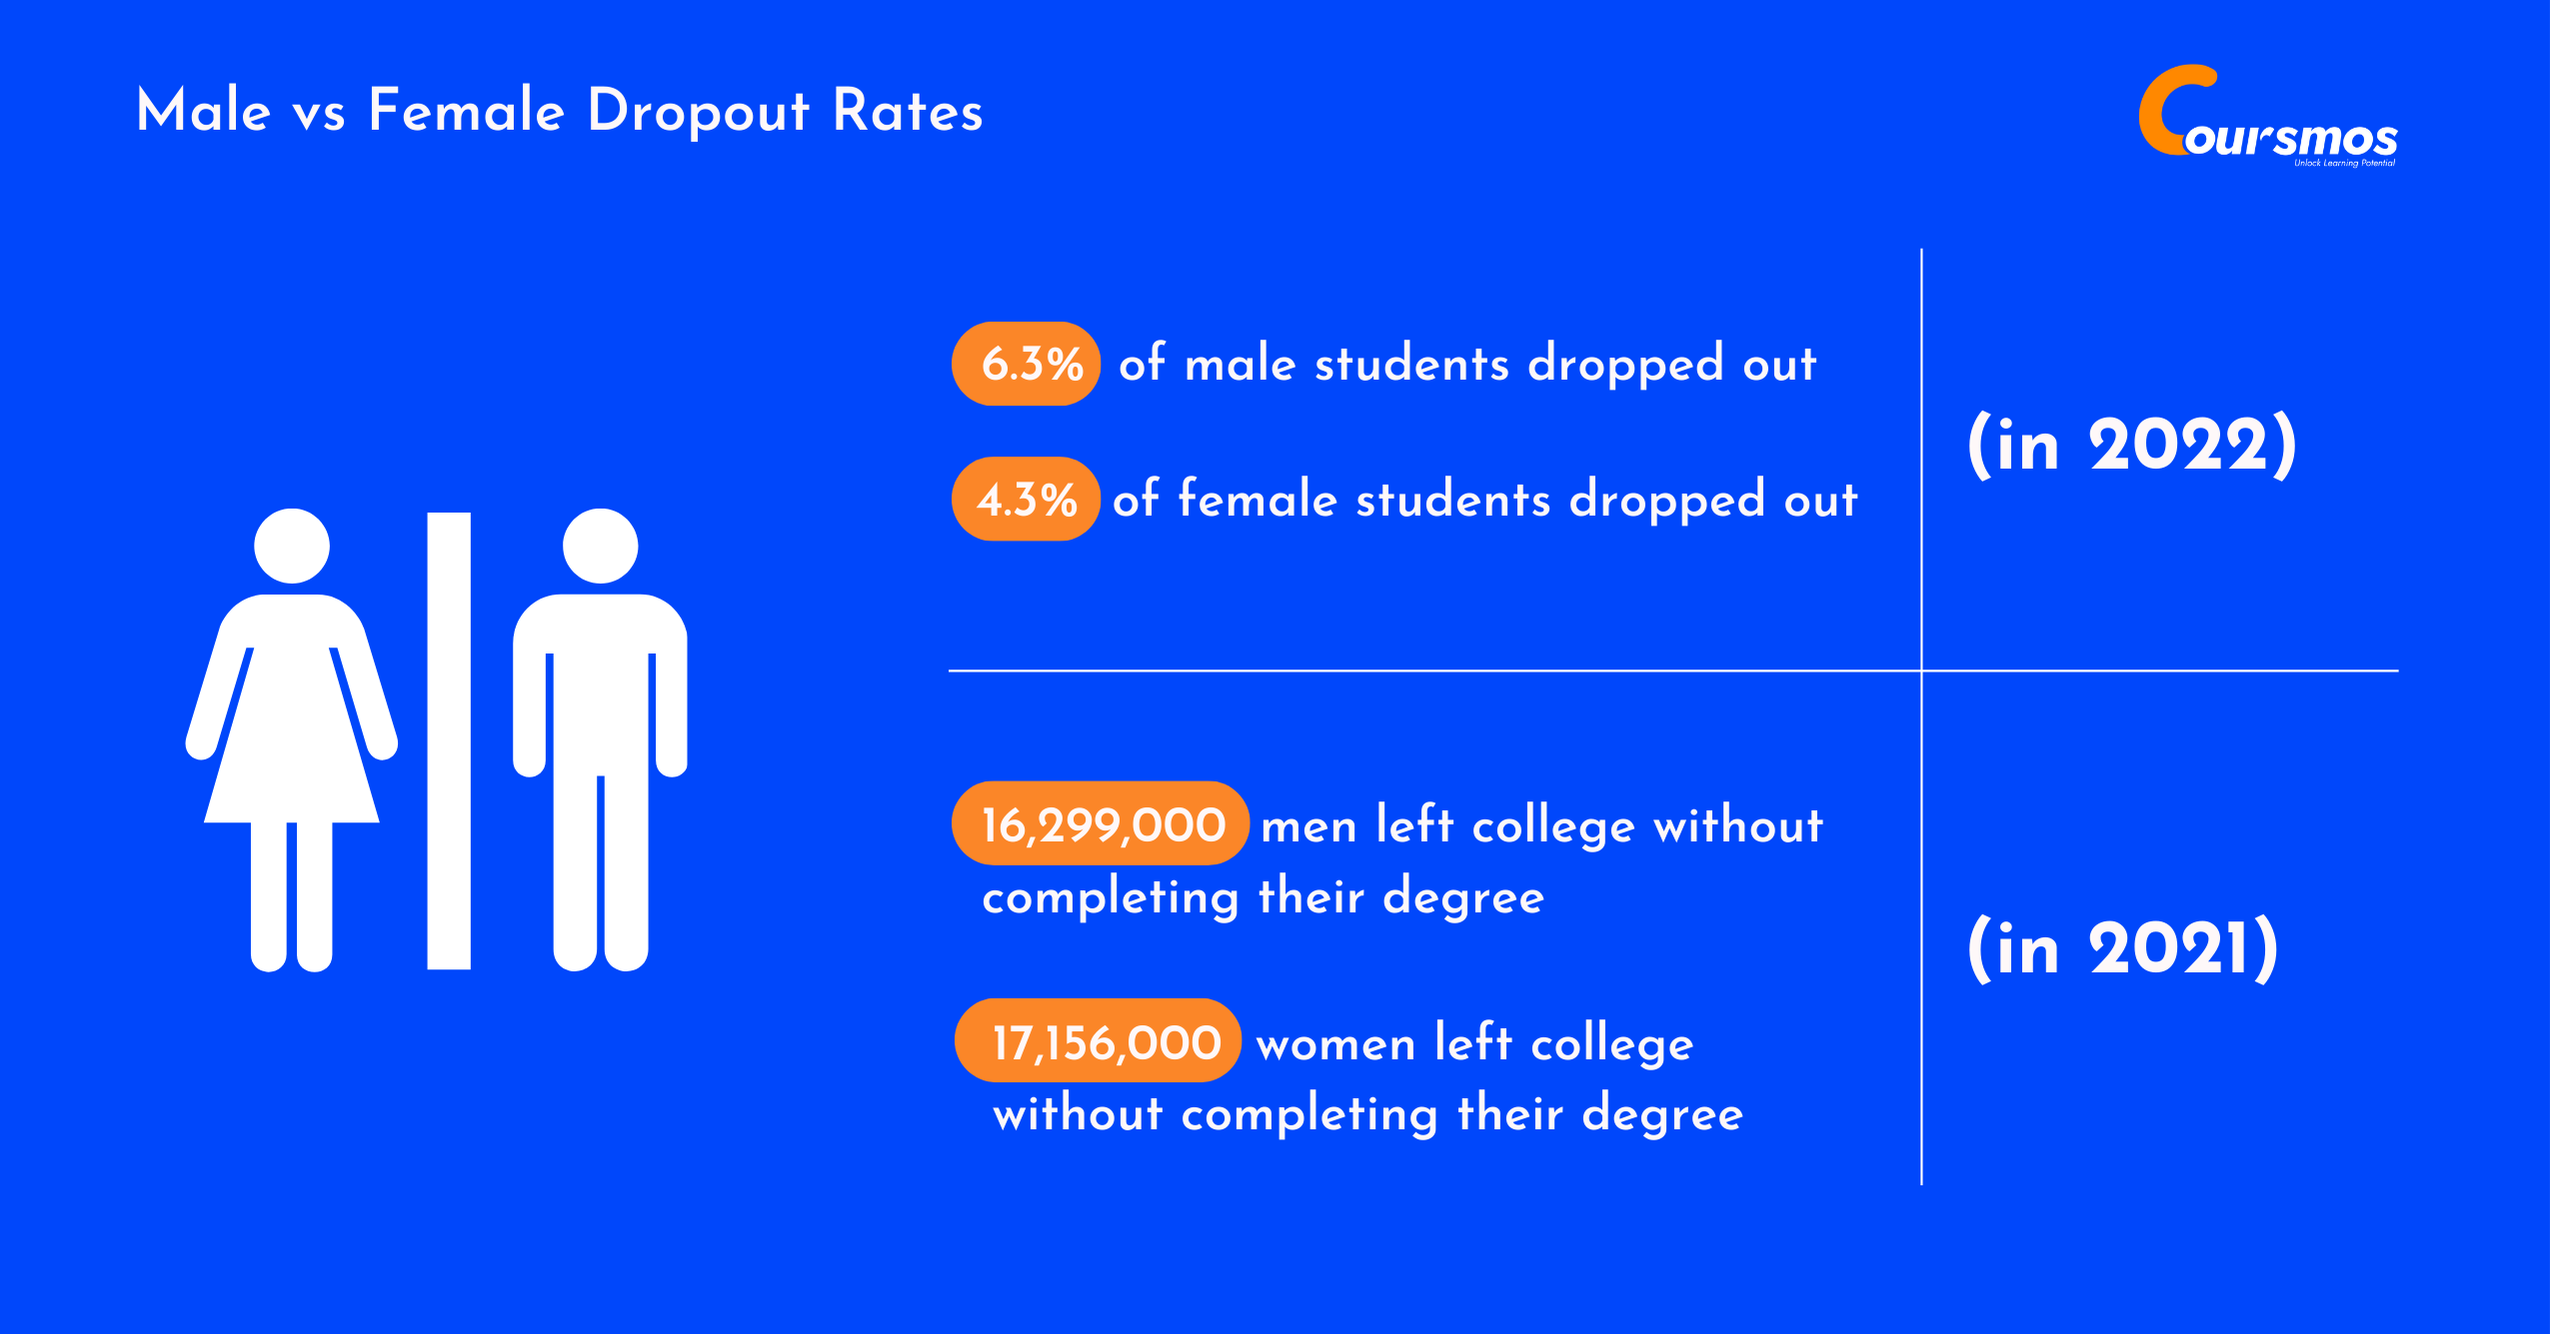
- 6.3% of male students dropped out compared to 4.3% of female students in 2022.
- 12.6% of American Indian/Alaska Native males had the highest dropout rate among all gender-racial combinations in 2022.
- 9.6% of Hispanic males dropped out compared to 6.1% of Hispanic females in 2022.
- 17.1 million women had some college but no degree in 2021, compared to 16.3 million men.
- 16,299,000 men left college without completing their degrees, while 17,156,000 women did the same in 2021.
(NCES)
Which Race Has The Highest Dropout Rate?
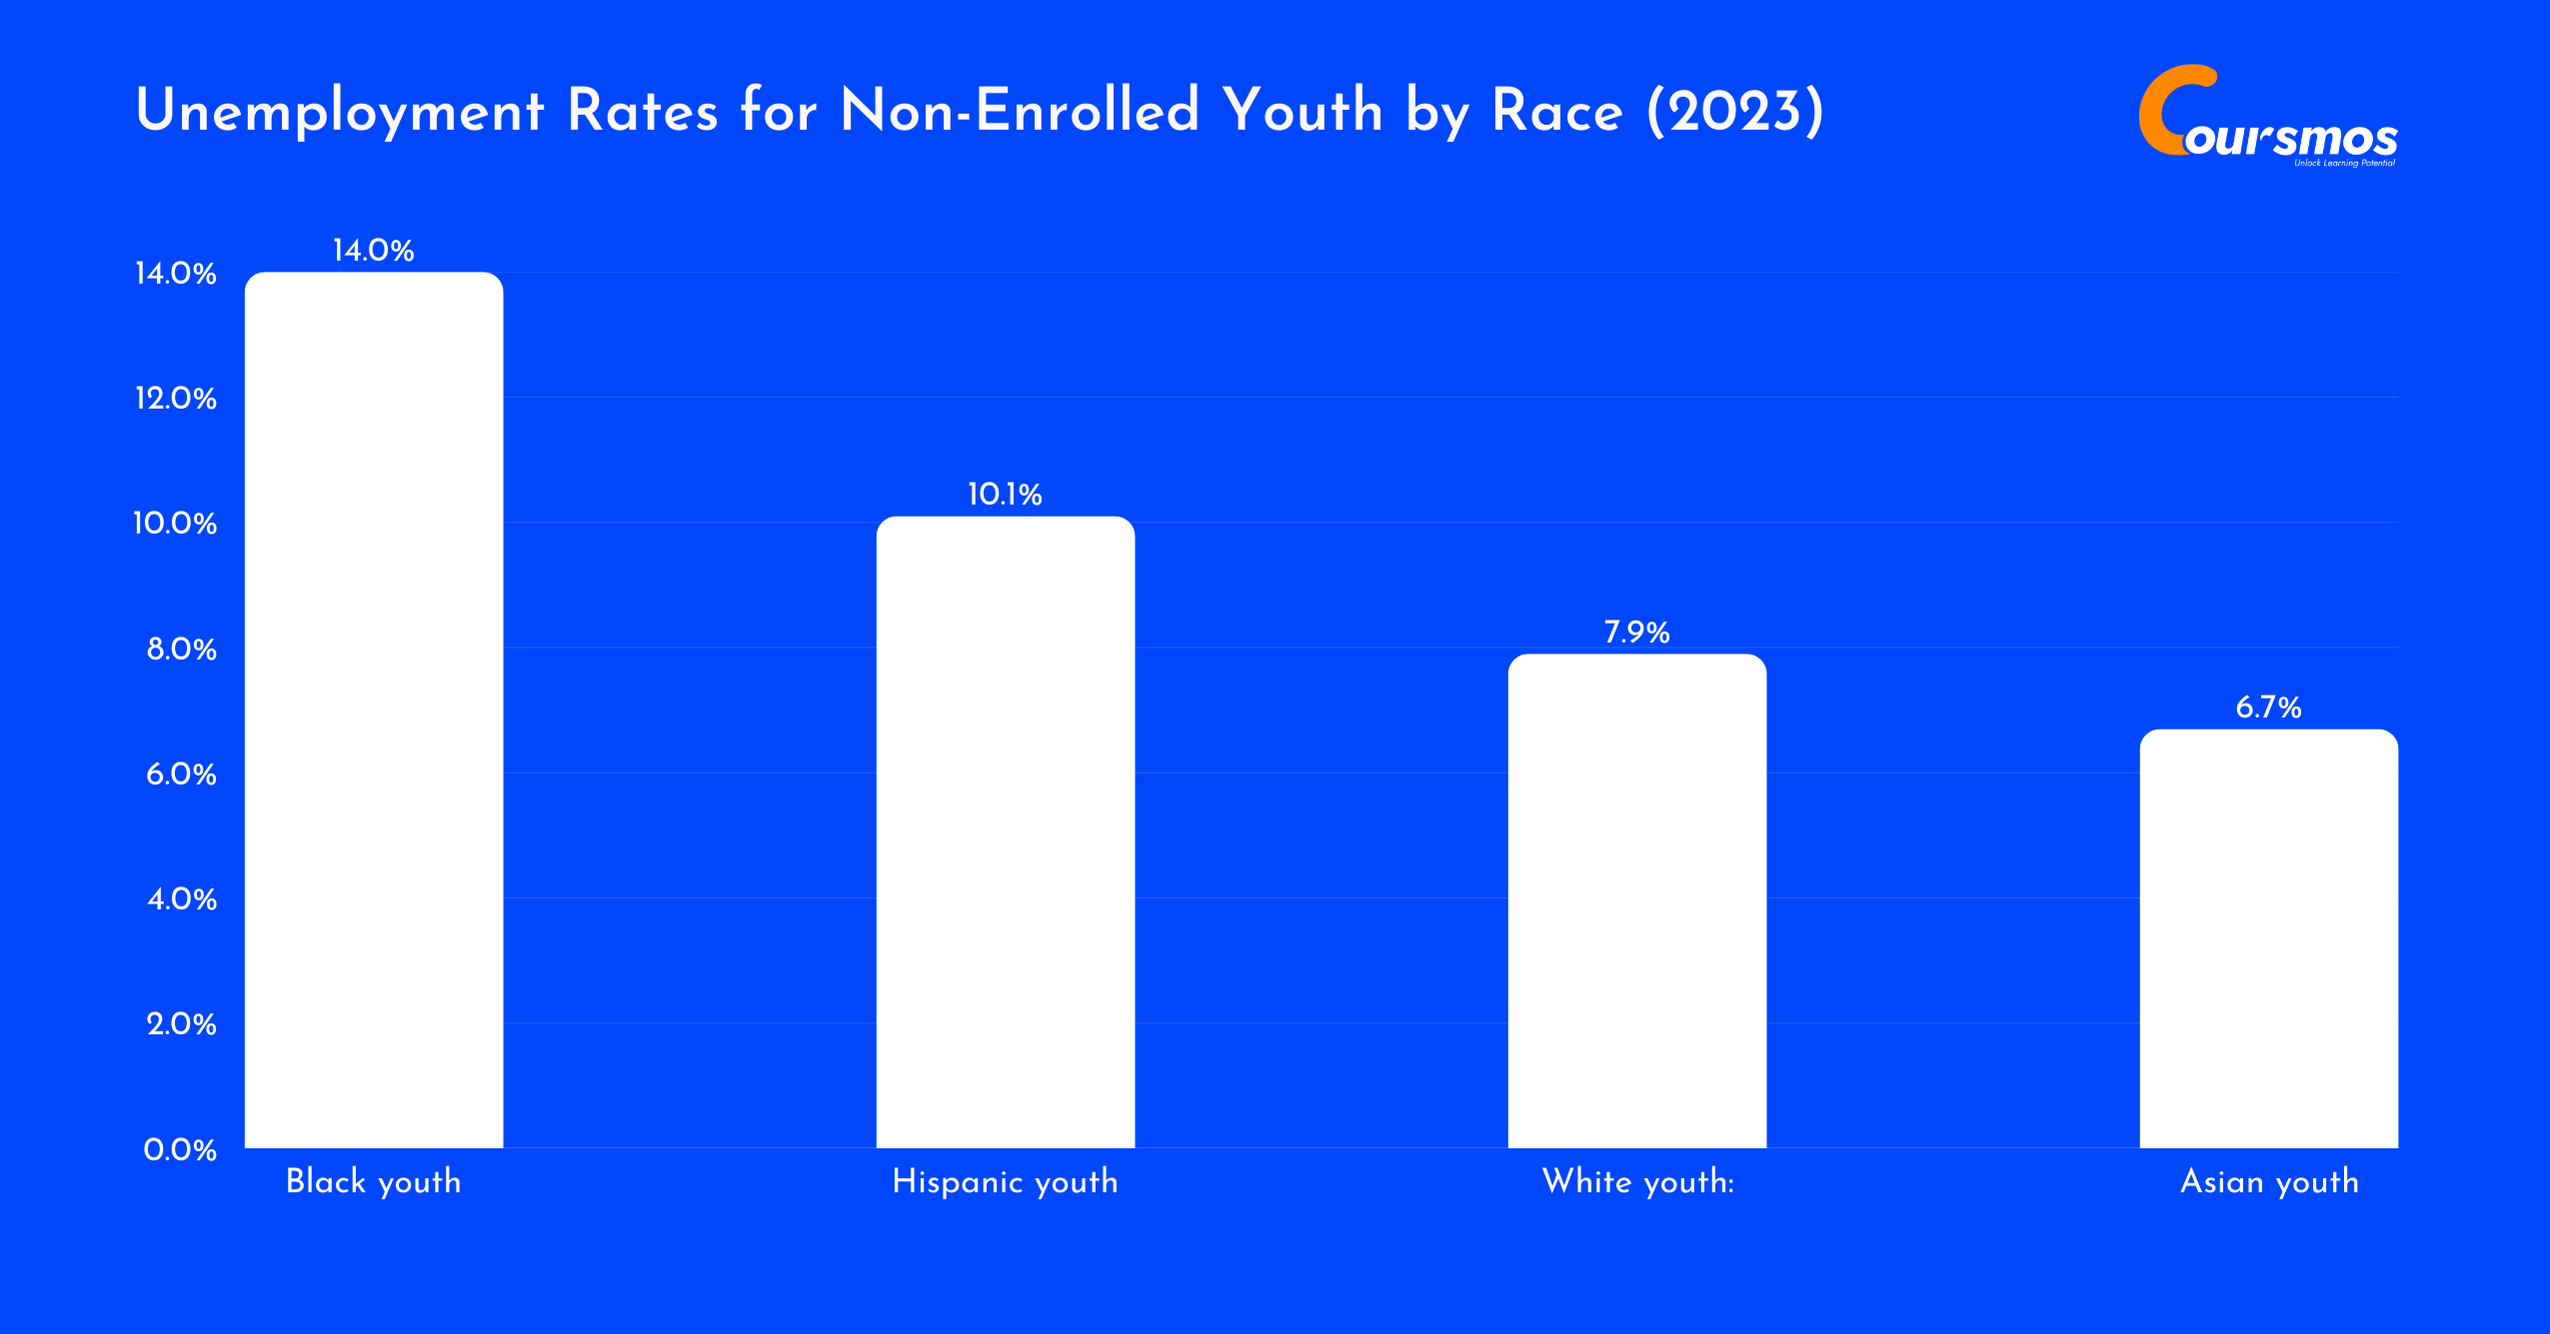
- The unemployment rates for youth not enrolled in school in 2023 vary significantly across racial and ethnic groups, shedding light on existing disparities:

- Black youth: 14.0% unemployment rate – the highest among all groups, indicating systemic barriers to employment.
- Hispanic youth: 10.1% unemployment rate, highlighting a persistent challenge but slightly lower than that of Black youth.
- White youth: 7.9% unemployment rate, showing a comparatively lower but still notable rate of unemployment.
- Asian youth: 6.7% unemployment rate, the lowest, reflecting relatively better employment outcomes.
(BLS)
What State Has The Highest Dropout Rate?
- California has the highest dropout rate, with 5.8 million (15.8% of all U.S. dropouts), followed by Texas with 2.5 million (6.9%) and New York with 1.8 million (5.1%).
- The top 5 states account for 36.4% of all college dropouts. California has more dropouts than the bottom 20 states combined.
Western states generally show higher dropout rates than the national average. The main reason could be the dense population in these regions in the USA.
Let us take a look at the top 10 states with the highest number of college dropouts in the USA in 2023:
| Rank | State | Total Dropouts | % of U.S. Total |
|---|---|---|---|
| 1 | California | 5,830,613 | 15.8% |
| 2 | Texas | 2,556,544 | 6.9% |
| 3 | New York | 1,893,457 | 5.1% |
| 4 | Illinois | 1,631,475 | 4.4% |
| 5 | Florida | 1,561,133 | 4.2% |
| 6 | Ohio | 1,256,009 | 3.4% |
| 7 | Michigan | 1,067,715 | 2.9% |
| 8 | Pennsylvania | 1,023,642 | 2.8% |
| 9 | North Carolina | 981,707 | 2.7% |
| 10 | Washington | 951,263 | 2.6% |
- D.C. has the lowest dropout rate nationwide, with only 35,515 dropouts.
- Northeastern states typically show lower-than-average rates. Southern states show mixed results, with some of the highest numbers but lower percentages relative to population.
10 States with the Lowest Number of College Dropouts:
| Rank | State | Total Dropouts | % of U.S. Total |
|---|---|---|---|
| 1 | District of Columbia | 35,515 | 0.1% |
| 2 | South Dakota | 65,859 | 0.2% |
| 3 | North Dakota | 68,330 | 0.2% |
| 4 | Vermont | 59,250 | 0.2% |
| 5 | Wyoming | 77,620 | 0.2% |
| 6 | Alaska | 93,531 | 0.3% |
| 7 | New Hampshire | 92,467 | 0.3% |
| 8 | Hawaii | 97,343 | 0.3% |
| 9 | Montana | 100,670 | 0.3% |
| 10 | Maine | 124,006 | 0.3% |
- Alaska has the highest dropout-to-undergraduate ratio, with dropouts outnumbering enrolled students almost 6-to-1.
Mississippi has the highest percentage (61.3%) of dropouts who were under age 25.
College Dropout Employment Rates
- 79.4% of young people aged 16-24 who were not enrolled in school were in the labor force in October 2023.
- 81.6% of young men not enrolled in school participated in the labor force compared to 76.9% of young women in 2023
- 9.2% was the unemployment rate for youth ages 16-24 not enrolled in school in October 2023.
(BLS)
- $992 was the median weekly earnings for college dropouts (those with some college but no degree) in 2023.
- A 3.3% unemployment rate was experienced by college dropouts in 2023, compared to 2.2% for bachelor’s degree graduates.
- $501 was the weekly earnings gap between college dropouts and bachelor’s degree holders in 2023.
(BLS)
More Stats Like This:
College Dropout Re-Enrollment Rates
- 943,200 former students re-enrolled in college during the 2022-23 academic year. However, only 2.6% of total dropouts attempt to re-enroll.
- 63% of returning students enrolled at a different institution than where they previously attended in 2022-23.
- 51.9% of returning students opted for associate degree programs, while 60.7% of these returning students are Hispanic students.
- Online institutions attract 22.9% of returning students.
- Meanwhile, 28.2% of returning students pursued bachelor’s degrees in 2022-23, and 13.3% enrolled in certificate programs in 2022-23.
- 4.4% of returning students earned a credential in their first year back in 2022-23. 56.6% of students who returned continued into a second year of studies, and 13.9% earned a credential within two years of returning to college.
FAQs
The provided documents don’t contain this information.
In 2023, dropouts face 23.5% unemployment compared to 15.8% for graduates, suggesting they generally face more employment challenges.
Harvard maintains a 96% freshman retention rate, with only 4% dropping out. The six-year graduation rate is 96.7%.
24.1% of first-time undergraduates drop out, with only 75.9% of full-time freshmen continuing from 2019 to 2020.